How the Spreadsheet UI Changed Over the Years
 General / October 23, 2017

For up-to-date Handsontable documentation, see handsontable.com/docs.
The word “change” excites some, and terrifies others. It is a word that always implies difference, and depending on what is changing, that difference could be good or bad. When it comes to technology, I like to view change as an evolution, a word that — in the non-biological context — suggests growth and development.
Technology has allowed the way we listen music to change: from something that could only be experienced live, to something that could be experienced almost anywhere, and any time. But this isn’t an article about how our enjoyment of music has changed over time; instead it is about how the spreadsheet UI has changed over the last 40-years.
The Emergence of Spreadsheet Software
When it comes to creating and sharing tables via desktop or mobile devices, the industry is pretty much dominated by Microsoft Excel and Google Sheets. But Google Sheets has only been publicly available since 2006, and Microsoft Excel for Windows dates back to 1987, while the first electronic spreadsheet program, VisiCalc, was released in 1978. VisiCalc was followed by SuperCalc in 1980, Multiplan (from Microsoft) in 1982, Lotus 1–2–3 in 1983, and the very first version of Microsoft Excel in 1985.
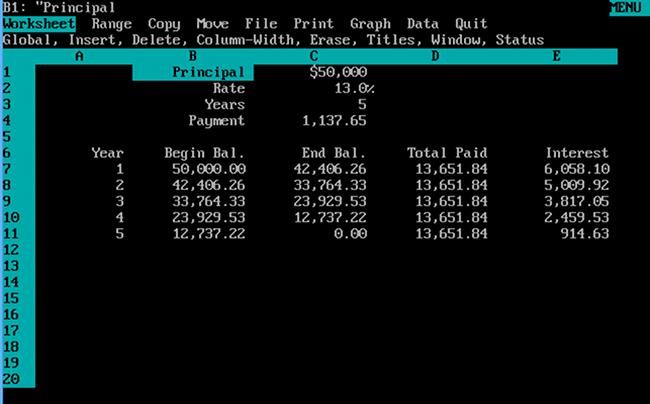
Lotus 1–2–3 quickly become an industry favourite, because it was the first spreadsheet program to offer charting, graphing, and basic arithmetic and database capabilities. However, like all spreadsheet software released up until this point, the user interface was a combination of the command line and text based menus — the mouse wasn’t a standard component at the time.
Accessing available menus in Lotus 1–2–3 was a simple as typing a forward slash, any text being added to a cell had to be preceded with a single quotation mark, and numbers had to start with a plus sign. Lotus 1–2–3 also introduced a formula structure very similar to the one still found in Microsoft Excel today.
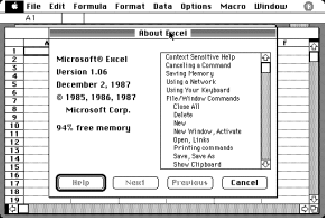
The first version of Microsoft Excel was released — for Mac only — in 1985. What set it apart was the use of a graphical user interface, with point and click capabilities, and pull-down menus. It also had a more refined grid system compared to Lotus 1–2–3. The first windows version only followed in 1987, with the first version of the all too familiar toolbar appearing in Excel 3.0, released in 1990.
Establishing the Table UI
Even as Excel 3.0 introduced the toolbar, the overall experience of using Excelwas — with the benefit of hindsight — not without quirks. For one, there was no right-click menu, and although Excel 3.0 supported multiple sheets that could feed into one consolidated sheet, switching between them could only be done via the Window menu. Chart options also started to improve, but always constrained by the limits of hardware: most computers at this time could only display up to 16 colours, and although some computers could support up to 32MB of RAM, they mostly shipped with 1–4MB of RAM.
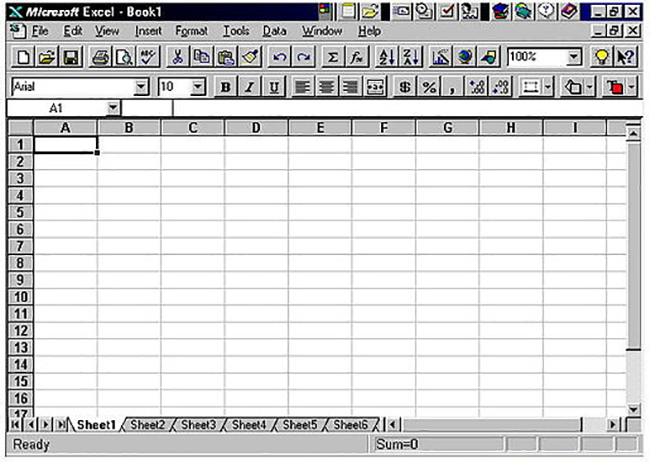
During the early 90s, Lotus 1–2–3 was still more popular than Microsoft Excel, but although Lotus 1–2–3 introduced a customisable toolbar before Microsoft, many users found the new features in Excel 5.0 better than those of Lotus 1–2–3. These included autofill, pivot tables, a broader range of formulas and functions, and extensive cell-editing capabilities.
The next few versions of Excel saw minor changes to the UI, with Excel 8.0 (part of MS Office 97) introducing the ability to merge cells, and conditional formatting, which followed the introduction of tabbed worksheets in MS Office 95. Merged cells and conditional formatting are two features so integral to spreadsheets that they are even found in web apps, such as Handsontable. Another visual change was the big raised buttons in the toolbar being flattened slightly, so although they weren’t the fully flat toolbars we now see in most spreadsheet software, they also weren’t as prominent as before.
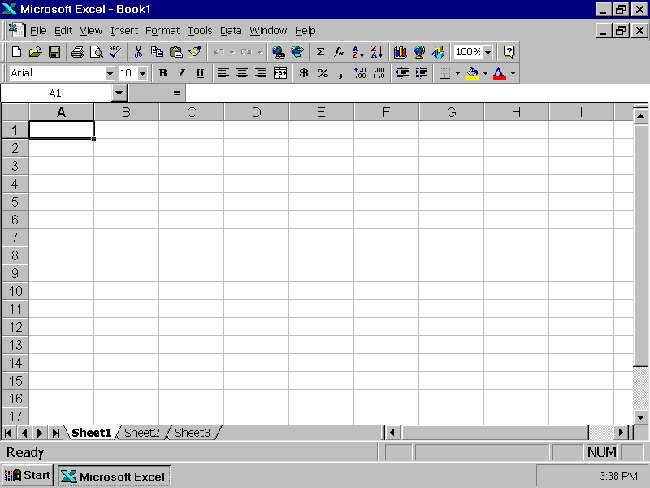
By 1996, the internet was more established than it was when MS Office 95 was released, so Excel 8.0 now integrated with your browser, included a web toolbar, and made it possible to publish spreadsheets online. This would all change even more over the next decade as our dependance on the internet and mobile phones grew.
Consolidating the Table UI
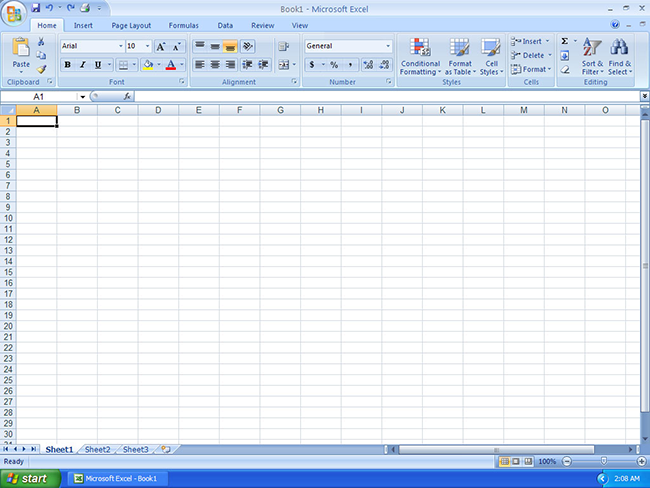
The next two versions of Excel (part of MS Office XP and Office 2003), would see further refinements to the UI, before Microsoft changed everything with the release of MS Office 2007. Coming soon after the release of the first public beta of Google Sheets, MS Office 2007 ditched the familiar menu and toolbar in favour of the Ribbon. The Ribbon consolidated and grouped all available functions into separate tabs, with further contextual tabs revealed when certain objects were selected. The purpose of this overhaul was to make features discoverable and accessible with fewer mouse clicks, and was perhaps necessary given how much spreadsheets had changed since 1985.
In stark contrast, Google Sheets still uses a paired down menu and toolbar.
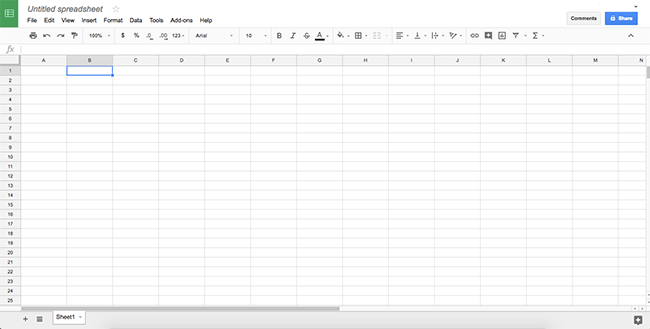
But Google Sheets has, from when it was first introduced, always been about allowing users to:
something MS Office didn’t do well until the introduction of Office Web Apps (now Office Online) in 2010.
Looking to the Future
The last few years have brought much more attention to UI and UX, especially as user behaviour is influenced by the use of mobile. But even though MS Office 2007 brought with it a dramatic rethinking of the menu and toolbar, it didn’t change the foundational features of spreadsheets, which are still present in Google Sheets and web components like Handsontable. Future developments in spreadsheet software will probably continue to focus on online collaboration, with continued improvements to how they manage large sets of data, with only minor enhancements to UI. There’s no need to reinvent the wheel, only improve its performance.
Chris Meier
Passionate about many things, knowledgable about some; curious and always learning.