What is a JavaScript Data Grid? Are all grids the same?
 Products / November 3, 2022
A data grid is essentially a feature-rich interface for working with tabular data. It seems similar to a traditional table, but the distinctions become apparent as you interact with it.
The traditional “table” refers to an interface that displays tabular data but doesn’t offer much interactivity. Consider the standard HTML table – it is excellent for showing simple two-dimensional data. However, once your needs expand to include things like pagination, filtering, and sorting, it quickly becomes apparent that you need something more functional.
This is where feature-rich data grids come in.
First, you need to consider how your application and users interact with your data, as this will help determine what kind of data grid you need. You may find that you have a lot of tabular data that your users need to be able to display, sort, filter, and visualize to draw various insights. On the other hand, you may find that your users need to enter data en masse in an Excel-like fashion.
Data grid libraries tend to fall into two broad categories, reflecting the delineation shown above: display-first and edit-first.
| Display-first | Edit-first | |
| Key distinctions |
|
|
| Typical use-cases |
|
|
| Functionality |
|
|
| Advanced features |
|
|
Key distinctions
Display-first data grids focus on sorting, filtering, pagination, and data display capabilities, such as charting, nested rows, and tree views. In contrast, edit-first grids concentrate on data manipulation, editing, and data entry.
Display-first tables are geared toward displaying complex tabular data. They also often include functionality for visualizing data through tree structures, nested rows, charts, and conditional formatting. Display-first solutions usually also provide basic cell-editing functionality, though this is not their primary focus, and they’re used for read-only purposes.
Edit-first data grids tend to have more advanced data entry, manipulation, and editing features and are more similar to tools like Excel than tables. Because of this, edit-first solutions are usually a good fit for data collection, maintenance, and analysis applications.
A popular form of the feature-rich data grid is the spreadsheet, popularized by applications like Excel and Google Sheets. These are standalone applications, so you cannot rely on them if you need data grid functionality in your application (well, unless you are okay with embedding iframes and keeping data on external servers). Obviously, you need a data grid component compatible with your technological stack to add such functionality to your app.
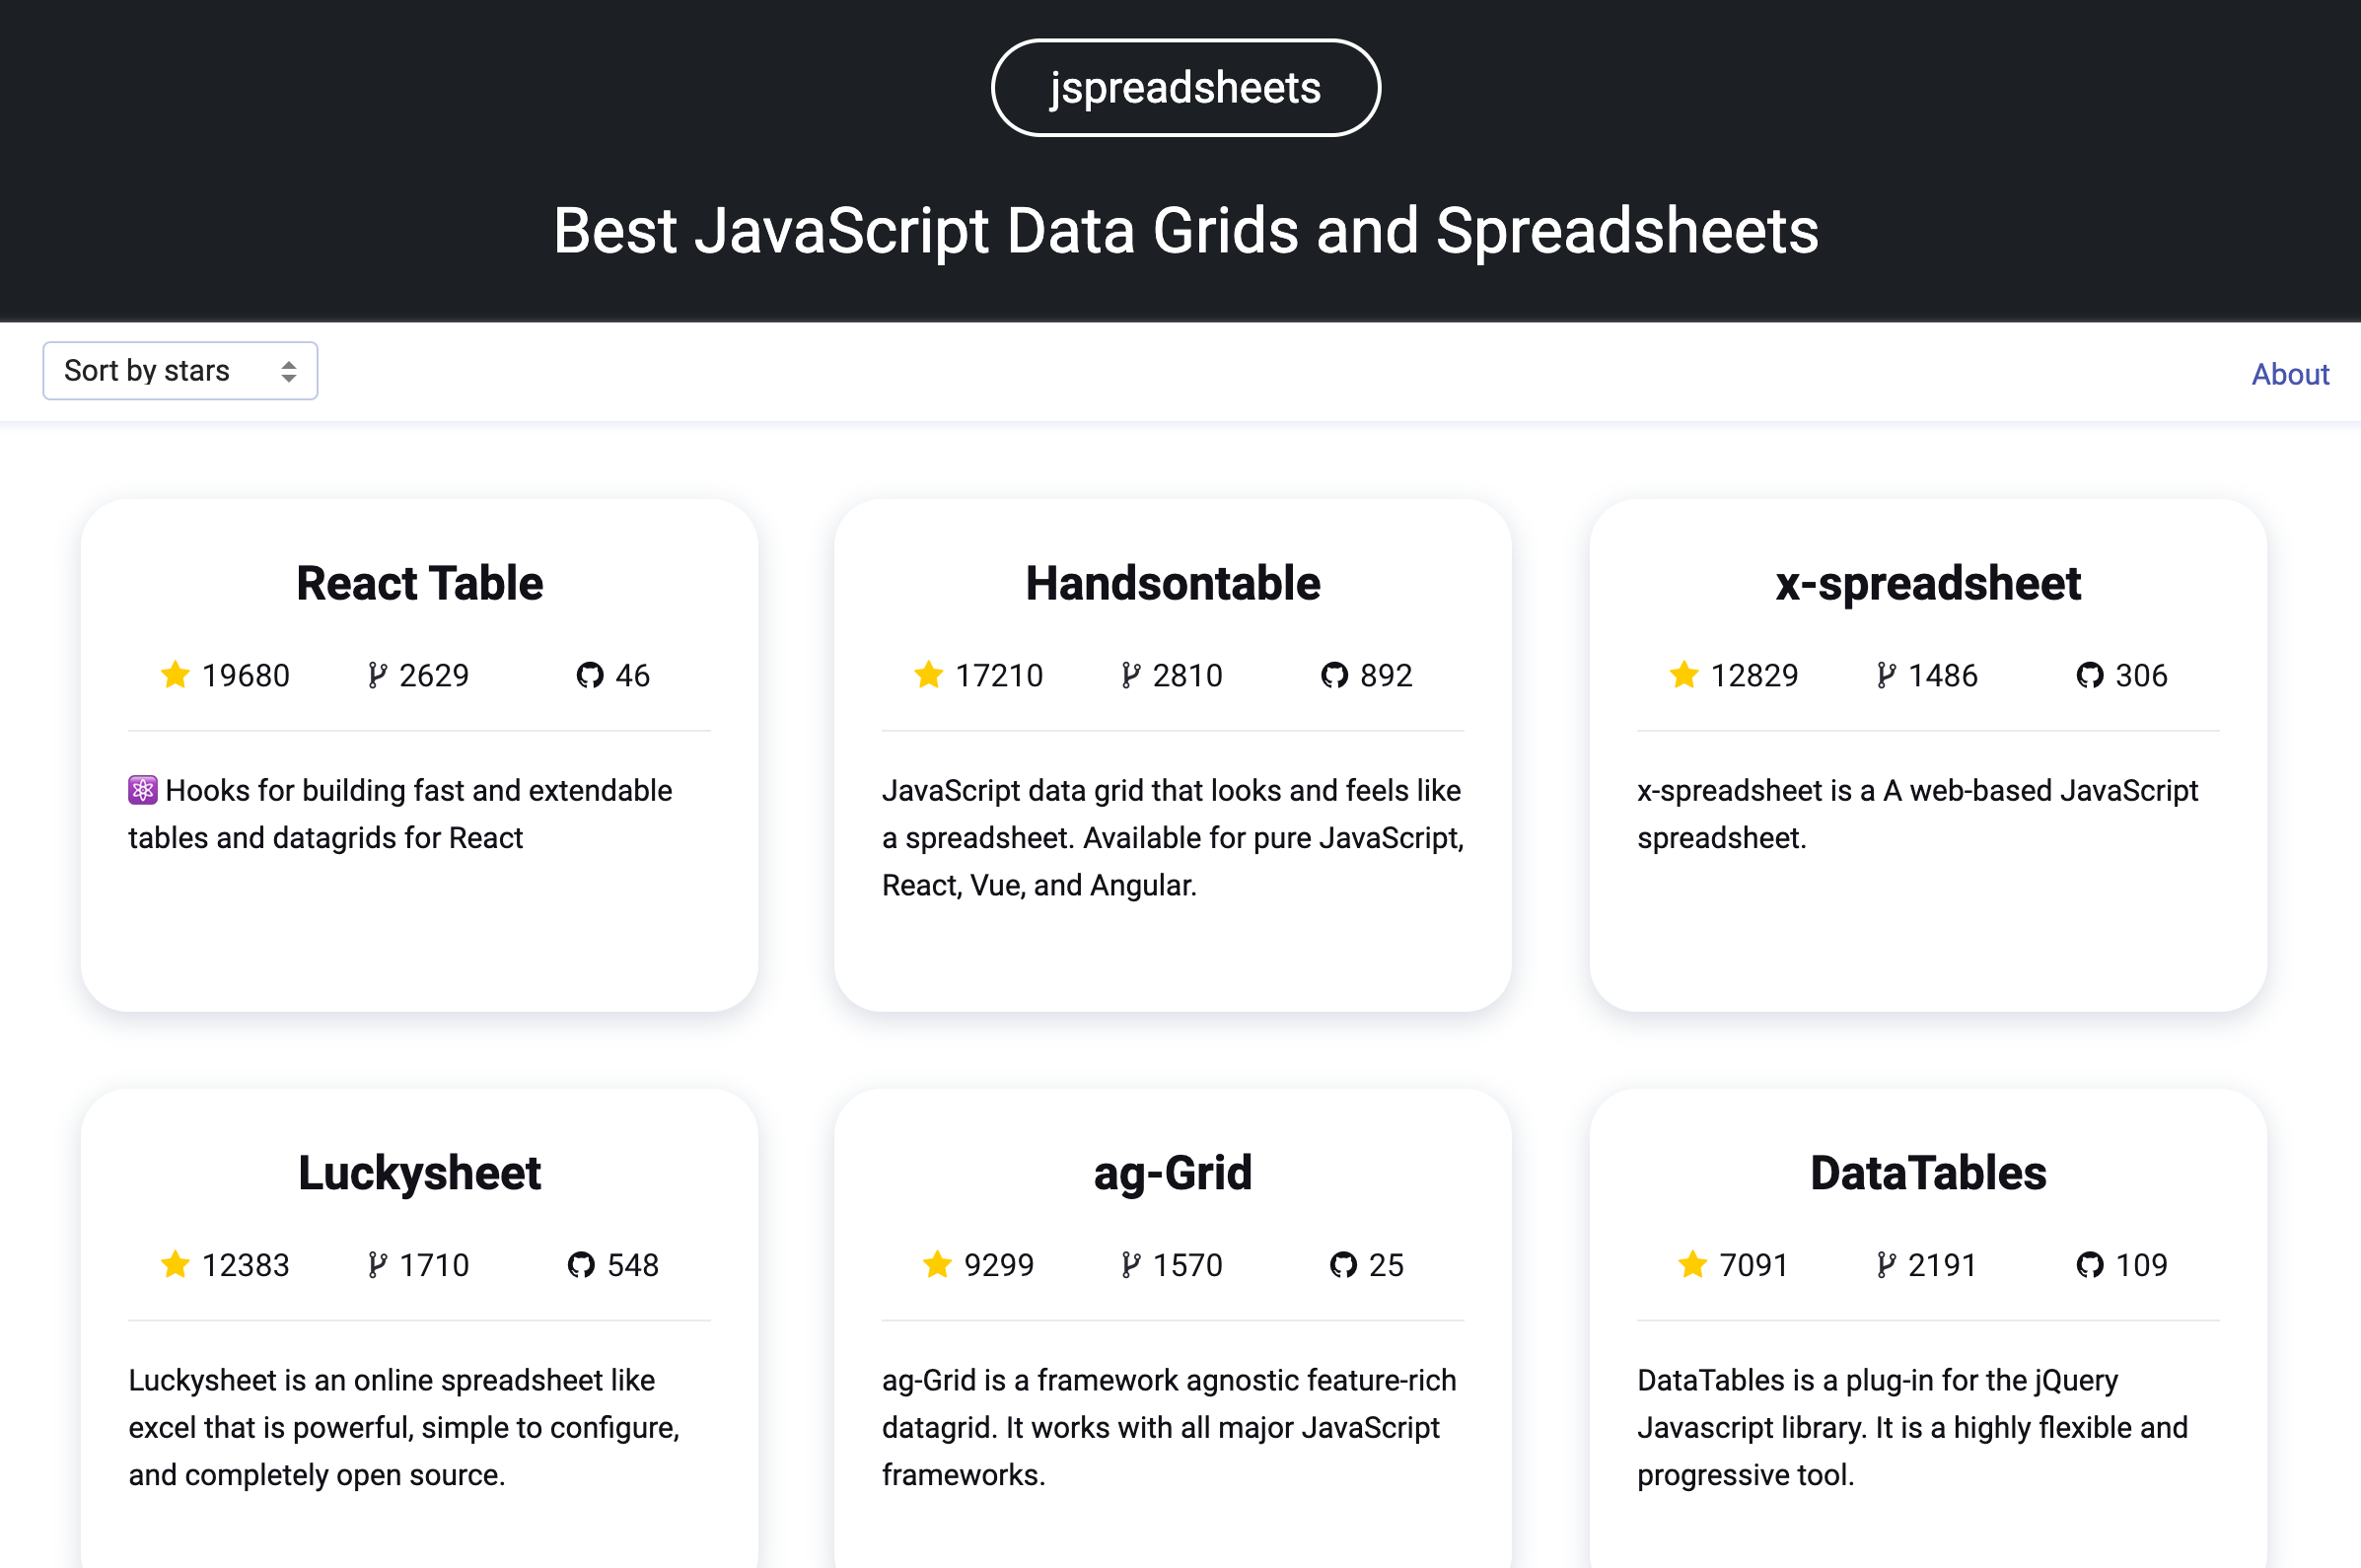
This is where data grid libraries and components come into play, such as the ones listed at jspreadsheets.com – a list of open-source and commercial data grids and spreadsheets for web applications.
Typical use cases
You will often use display-first grids in applications with moderate to heavy data visualization needs. This could be things like CRM, where you might have lots of data in the form of orders, customer details, and other details. You will need a grid to search through data to find relevant records, draw attention to a particular piece of information, such as poor customer health, or visualize data differently to better understand and draw insights from it.
An edit-first data grid wouldn’t typically be used when you are simply trying to display read-only data, as their strengths lie elsewhere. You find them used in cases where you need to work with data in a more creative or destructive capacity. The three common scenarios for using edit-first grids are data analysis, collection, and maintenance.
- Data collection is when a grid facilitates controlled data entry and allows you to enter values into cells, where the values will be subject to scrutiny and validation. This can be useful for maintaining data quality by ensuring that the values entered are valid.
- Data maintenance typically involves loading existing data from another source, such as a database or file. The grid is then used to present the data in a format that is easy to modify and update. This can be useful when you have data that you need to update periodically, like pricing information or planning documents.
- Data analysis encompasses activities you might undertake to draw insights from your data. This will often involve the use of calculations, which are cells that derive their values from a formula that can use the values of other cells as input. Again, think of spreadsheets – they use dedicated engines to make calculations possible, and many businesses rely heavily on these tools’ analytical abilities.
Learn how Shareline used Handsontable to build an app with a smooth and familiar user experience ⟶
Edit-first data grids
Features like undo and redo, shortcuts, and cell comments provide functionality that can be essential when you are carrying out significant operations in the data grid treated as a data editor. Those features become crucial because simple mistakes can have a magnified effect, and manually rectifying such mistakes (even only typos) can be expensive and laborious.
The advanced features in edit-first grids focus on giving users more powerful ways to create and manipulate data. Consider Handsontable’s formula engine, which allows users to write formulas similar to Excel or Google Sheets. Handsontable also features merge cell functionality for combining the horizontal or vertical space of two or more cells to facilitate longer values.
Finally, Handsontable also allows autofill cells, another feature that users of popular spreadsheet programs would likely be familiar with. Features like this can save significant amounts of time regarding data onboarding and maintenance, as they can eliminate the need to enter many repetitive or sequential values.
Explore Handsontable for React
Wrapping up
You have been introduced to the two broad categories of JavaScript data grids, display-first, and edit-first. You have seen how these types of grids are similar and, more importantly, where they differ. While there are multiple options for data grids of each type, high-quality, edit-first data grids can be challenging to find, as they require complex functionality and are harder to do well.
If you need a well-made, edit-first data grid, consider Handsontable, a robust data grid built for web applications with wrappers for React, Angular, Vue 2, and Vue 3, as well as first-party TypeScript support.
Get started with Handsontable today.
Cameron Pavey
Full-stack PHP/JS Dev 🚀 Code and fancy keyboards.