
Data grid components are great for sorting and filtering large data sets, making them especially useful in applications working with financial or statistical data.
In this tutorial, you’ll see how to quickly build a public ledger to track your company’s expenses. The ledger will track expenses with the amount, the department, and a descriptive note. It will also summarize the total expense, average, and maximum transaction amount. You’ll use React as the frontend library and Handsontable as the data grid library to implement the ledger functions.
Building the ledger application
Before getting started, you’ll need the following:
- Node.js (this tutorial uses version 14, but newer versions are also fine)
- npm version 6 or above
- A code editor such as VS Code to implement the application
Initializing the project
To start with the development, initialize a new React project using Create React App by running the following:
npx create-react-app data-grid-with-handsontable
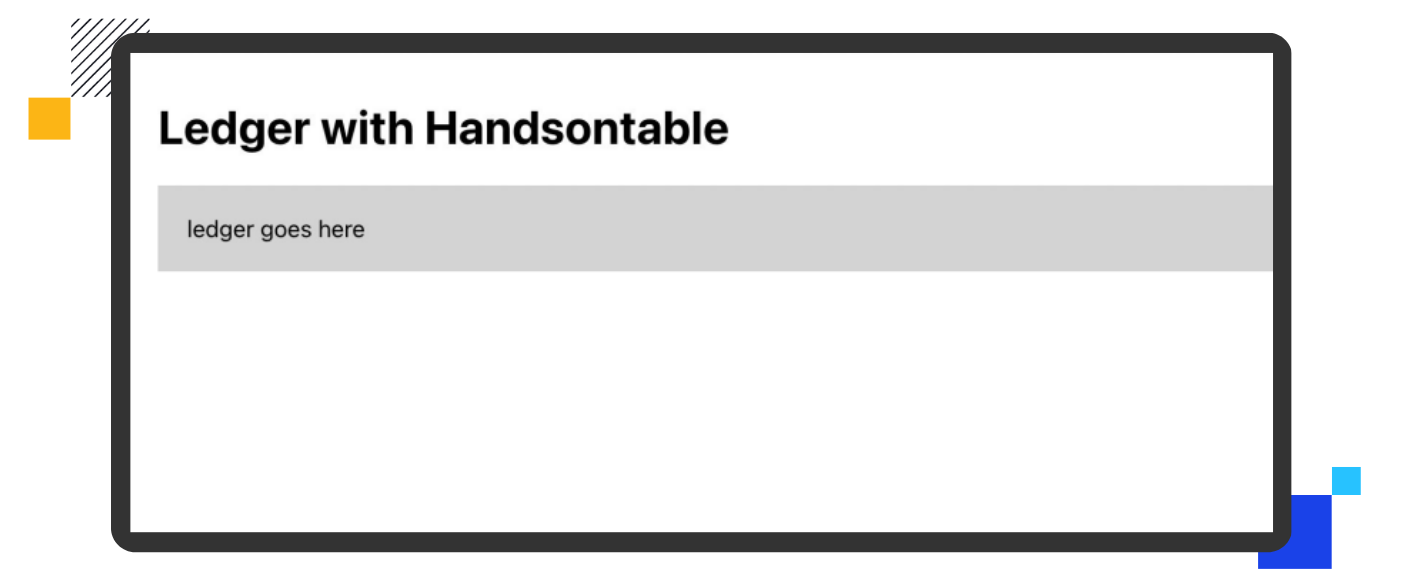
Open the project inside the code editor and update the src/App.js file to create a basic layout for your ledger application:
import './App.css';

function App() {
    return (
        <div style={{padding: '10px 20px'}}>
            <h1>Ledger with Handsontable</h1>
            <hr/>
            <div style={{backgroundColor: 'lightgray', padding: 20}}>
                ledger goes here
            </div>
        </div>
    );
}

export default App;
Run npm start in the terminal to start the application and open http://localhost:3000 it in a web browser. You’ll see the basic layout of the application.
Implementing the data grid
With the basic layout in place, you can start implementing the ledger as a data grid. Run the following command to install the Handsontable package using npm:
npm install handsontable @handsontable/react
Open the src/App.js file and import the HotTable component from Handsontable’s React library. Import the registerAllModules function to register Handsontable’s modules before using them. Also, import the Handsontable CSS file to use the default styling.
In the App component, create a state variable called data to hold the rows for the data grid and pass it to the HotTable component as props along with colHeaders, as shown below.
import './App.css';
import {HotTable} from '@handsontable/react';
import {registerAllModules} from 'handsontable/registry';
import 'handsontable/dist/handsontable.full.min.css';
import {useState} from 'react';

// register Handsontable's modules
registerAllModules();

function App() {
    const [data, setData] = useState([
        ['Setting up the ledger', 'Engineering', 400],
    ]);

    return (
        <div style={{padding: '10px 20px'}}>
            <h1>Ledger with Handsontable</h1>
            <hr/>
            <h2>Ledger</h2>
            <HotTable
                data={data}
                rowHeaders={false}
                colHeaders={['Note', 'Department', 'Amount ($)']}
                height="auto"
                licenseKey="non-commercial-and-evaluation"
            />
        </div>
    );
}

export default App;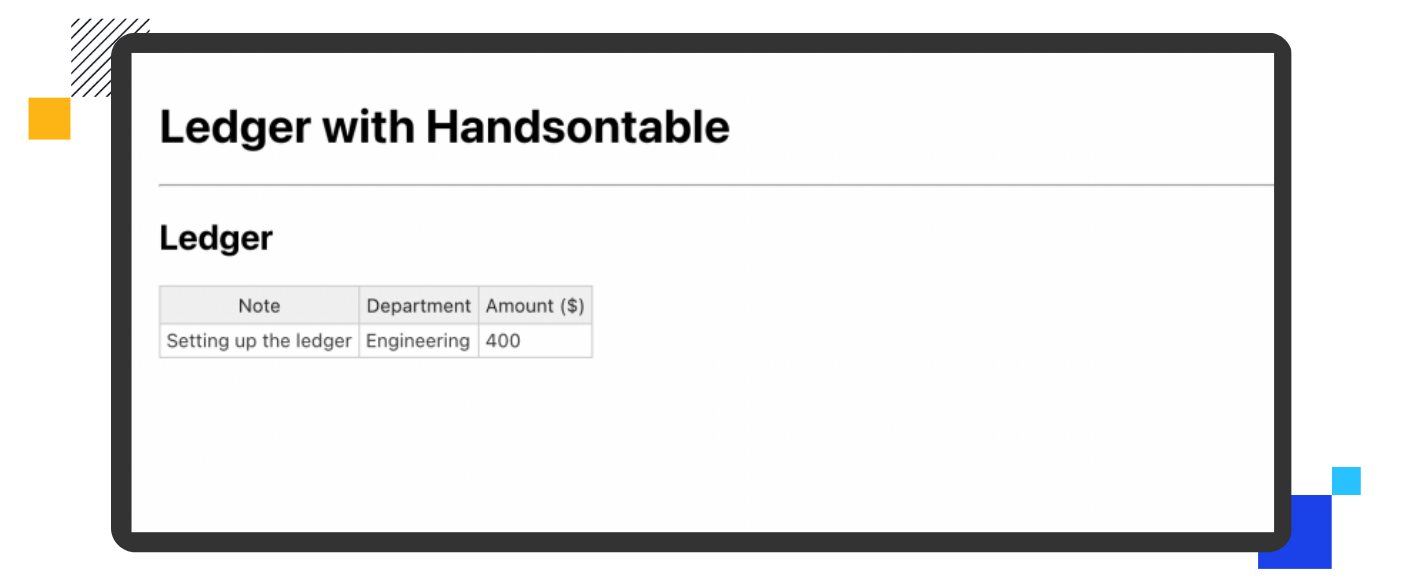
The user can type anything into the Department column, which can lead to inconsistent data. To avoid this, create a list of departments as constant DEPARTMENTS and create a config object called DepartmentConfig to specify selectOptions as DEPARTMENTS. Pass DepartmentConfig in the prop columns to the HotTable component to configure the second column as a select option, as shown below:
// ...imports and constants

const DEPARTMENTS = [
    'Sales',
    'Engineering',
    'Product',
    'Marketing',
    'Accounts',
];

const DepartmentConfig = {
  editor: "select",
  selectOptions: DEPARTMENTS,
}

function App() {
    const [data, setData] = useState([
        ['Setting up the ledger', 'Engineering', 400],
    ]);

    return (
        <div style={{padding: '10px 20px'}}>
            <h1>Ledger with Handsontable</h1>
            <hr/>
            <h2>Ledger</h2>
            <HotTable
                data={data}
                columns={[
                    {},
                    DepartmentConfig ,
                    {},
                ]}
                rowHeaders={false}
                colHeaders={['Note', 'Department', 'Amount ($)']}
                height="auto"
                licenseKey="non-commercial-and-evaluation"
            />
        </div>
    );
}

export default App;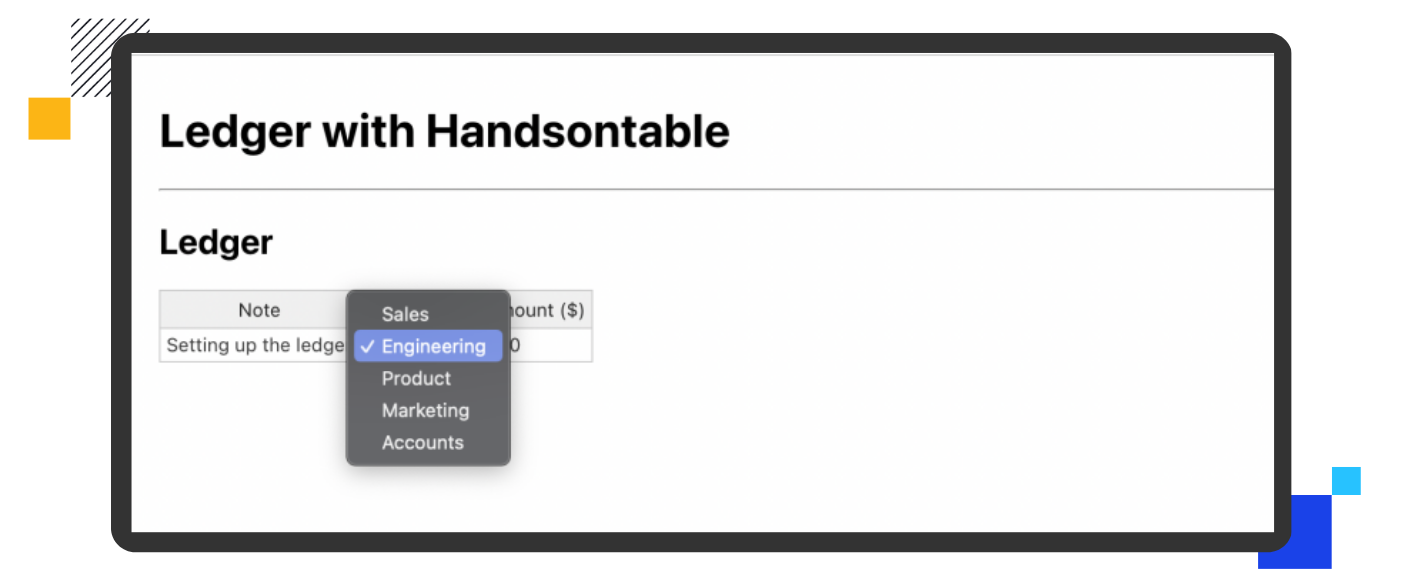
You’ll notice that the Amount column is not yet formatted as a currency, which in this case should be US dollars. To fix this, create the new constant AmountConfig to set the type and formatting for the Amount column. Pass AmountConfig to HotTable in the columns prop, as shown below:
// ...imports and constants

const AmountConfig = {
    type: "numeric",
    numericFormat: {
        pattern: "$0,0.00",
        culture: "en-US",
    },
};

function App() {
    //... React component code
        <HotTable
            data={data}
            columns={[
                {},
                DepartmentConfig,
                AmountConfig, // format the value as USD
            ]}
            rowHeaders={false}
            colHeaders={['Note', 'Department', 'Amount ($)']}
            height="auto"
            licenseKey="non-commercial-and-evaluation"
        />
}

export default App;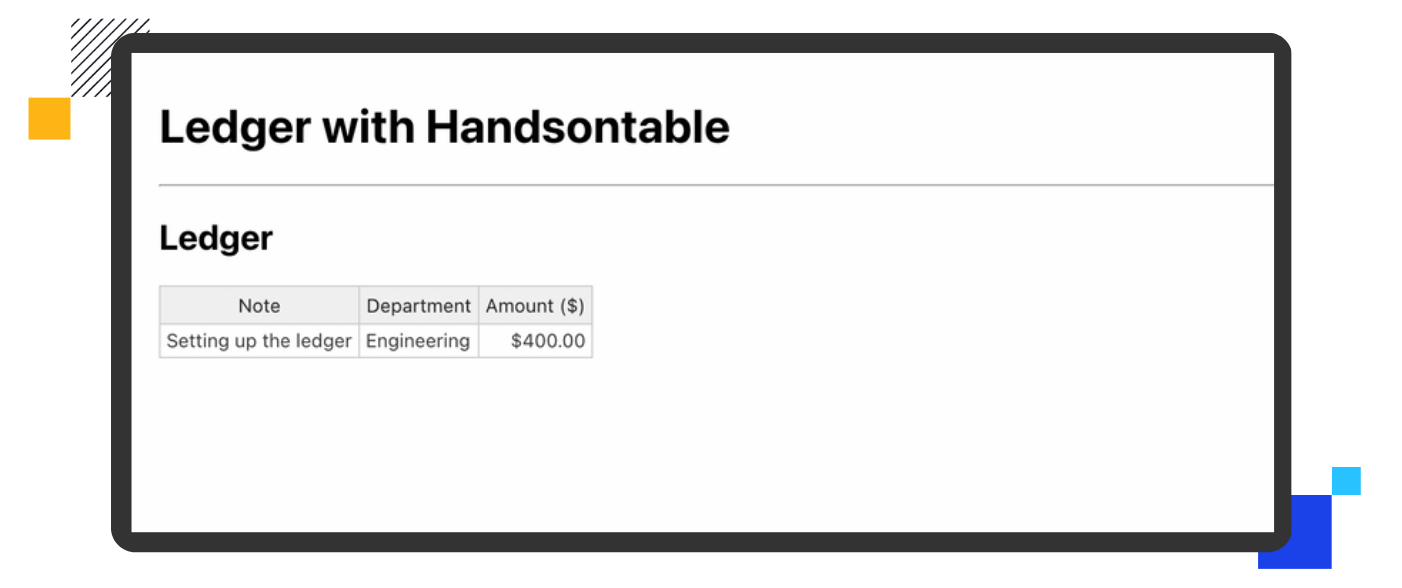
The Amount is now formatted correctly, but the ledger only has one row. To allow users to add more rows, create a button that adds a new row to the data state when clicked:
// ...imports and constants
function App() {
    const [data, setData] = useState([
        ['Setting up the ledger', 'Engineering', 400],
    ]);

    return (
        <div style={{padding: '10px 20px'}}>
            <h1>Ledger with Handsontable</h1>
            <hr/>
            <h2>Ledger</h2>
            <HotTable
                data={data}
                columns={[
                    {},
                    DepartmentConfig,
                    AmountConfig,
                ]}
                rowHeaders={false}
                colHeaders={['Note', 'Department', 'Amount ($)']}
                height="auto"
                licenseKey="non-commercial-and-evaluation"
            />
            <button
                style={{marginTop: 10}}
                onClick={() => setData((prevData) => [...prevData, ['', '', '']])}
            >
                Add row
            </button>
        </div>
    );
}

export default App;
Users can now add as many rows as they want, but they need to help track meaningful information like total expenditure and maximum transaction value.
The HyperFormula library offers formula capabilities similar to those of Microsoft Excel, such as SUM and MAX, and can be used with the Handsontable data grid component. Run the following command to install the HyperFormula npm package:
npm i hyperformula
Now, update src/App.jsx to create an instance of Hyperformula:
// ... imports
import {HyperFormula} from "hyperformula"; // import HyperFormula

// ... constants

function App() {
    const [data, setData] = useState([
        ["Setting up the ledger", "Engineering", 400],
    ]);

    // create an external HyperFormula instance
    const hyperformulaInstance = HyperFormula.buildEmpty({
        licenseKey: "internal-use-in-handsontable",
    });

    return (
        // ... return the component
    );
}

export default App;
Pass hyperformulaInstance in the formulas prop to HotTable along with sheetName; you can refer to this HotTable data later using sheetName:
<HotTable
    data={data}
    columns={[
        {},
        DepartmentConfig,
        AmountConfig,
    ]}
    formulas={{
        engine: hyperformulaInstance,
        sheetName: 'ledger',
    }}
    rowHeaders={false}
    colHeaders={['Note', 'Department', 'Amount ($)']}
    height="auto"
    licenseKey="non-commercial-and-evaluation"
/>
Create another table showing the total expense, average, and maximum transaction value. For this new table, create a constant named STATISTICS containing the formulas and pass AmountConfig in the columns prop for all columns as they’ll have dollar amounts.
import './App.css';
import {HotTable} from '@handsontable/react';
import {HyperFormula} from 'hyperformula';
import {registerAllModules} from 'handsontable/registry';
import 'handsontable/dist/handsontable.full.min.css';
import {useState} from 'react';

// register Handsontable's modules
registerAllModules();

const DEPARTMENTS = [
    'Sales',
    'Engineering',
    'Product',
    'Marketing',
    'Accounts',
];

const DepartmentConfig = {
  editor: "select",
  selectOptions: DEPARTMENTS,
}

const STATISTICS = [
    ['Sum ($)', 'Average ($)', 'Max ($)'],
    [
        '=SUM(ledger!C:ledger!C)',
        '=AVERAGE(ledger!C:ledger!C)',
        '=MAX(ledger!C:ledger!C)',
    ],
];

const AmountConfig = {
    type: 'numeric',
    numericFormat: {
        pattern: '$0,0.00',
        culture: 'en-US',
    },
};

function App() {
    const [data, setData] = useState([
        ['Setting up the ledger', 'Engineering', 400],
    ]);

    const hyperformulaInstance = HyperFormula.buildEmpty({
        licenseKey: 'internal-use-in-handsontable',
    });

    return (
        <div style={{padding: '10px 20px'}}>
            <h1>Ledger with Handsontable</h1>
            <hr/>
            <h2>Ledger</h2>
            <HotTable
                data={data}
                columns={[
                    {},
                    DepartmentConfig,
                    AmountConfig,
                ]}
                formulas={{
                    engine: hyperformulaInstance,
                    sheetName: 'ledger',
                }}
                rowHeaders={false}
                colHeaders={['Note', 'Department', 'Amount ($)']}
                height="auto"
                licenseKey="non-commercial-and-evaluation"
            />
            <button
                style={{marginTop: 10}}
                onClick={() => setData((prevData) => [...prevData, ['', '', '']])}
            >
                Add row
            </button>
            <h2>Statistics</h2>
            <HotTable
                data={STATISTICS}
                height="auto"
                formulas={{
                    engine: hyperformulaInstance,
                    sheetName: 'statistics',
                }}
                columns={[AmountConfig, AmountConfig, AmountConfig]}
                licenseKey="non-commercial-and-evaluation"
            />
        </div>
    );
}

export default App;
Finally, check out the working example in the following demo:
Pros and cons of using off-the-shelf components
It’s worth discussing some pros and cons of using off-the-shelf components like Handsontable:
✅ Pros
- Faster time to market: Opting for a pre-built choice for complex components such as data grids can save you time on research and development. You can use this time to develop the core of your application and iterate over more critical feature requests.
- Well-tested and reliable: The more a component is used, the better tested it becomes. Every new user becomes the tester and advisor of the component. This is why using a popular ready-made component is advisable, as it’s likely to have been through a lot of scrutinies and is now trusted by teams like yours.
- Support: Support isn’t just about a product offering a dedicated team you can revert to for issues and queries. It’s also about developers supporting each other when they face issues and resolving them collectively in forums such as Stack Overflow or GitHub.
- Maintenance isn’t your problem: If you choose to create your own components, the effort doesn’t end with developing them. You’ve got to keep updating the dependencies, testing the components every time a tiny feature is changed, and writing and maintaining the corresponding documentation. On the other hand, when you use an off-the-shelf component, all of this effort is transferred to the maintainers, whose complete focus is on keeping the components up-to-date.
❌ Cons
Most off-the-shelf components cater to a broad community, meaning they cover common use cases and implementations. This can mean that the component may lack a feature that’s unique to your application.
As long as the off-the-shelf component responds to your specific use case, it can be an excellent option for your team. A solid component will offer a supportive community, active contributors, and a customer success team. Handsontable ticks all the boxes as an off-the-shelf solution, making it ideal for building an application based on data grid components.
Conclusion
You’ve successfully built a ledger application for your company. While doing so, you learned about data grid components and their usefulness for building applications with tabular data computation. You also used Excel-like formulas in your web application to add advanced functionality, such as calculating average transaction value.
Extend the example by adding features like highlighting high-value transactions or spotting the most frequent transaction. You can also read the Handsontable documentation to learn about implementing these features.

Anshuman Bhardwaj
A craftsman of React and JavaScript 🛠️ Enjoying solving everyday problems with code and sharing his learnings with the world.