An Interview with Mirko Lorenz from Datawrapper

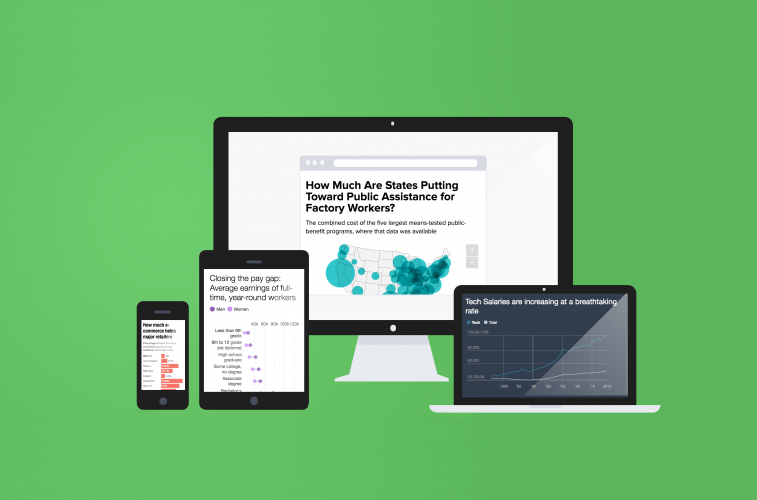
Have you ever heard about Datawrapper ? If you are a journalist working in a fast-paced environment I am sure you have. Datawrapper is a tool that let users create high-quality charts and maps in a short period of time. It is not surprising that it is specifically strong in newsrooms around the world. Mirko Lorenz, who is a co-founder and CEO of Datawrapper, decided to use Handsontable to support his product. As a result, a small dedicated team managed to create a tool that is considered a must-have in work environments where time is always the scarce resource.
We had a pleasure to talk to Mirko about his product and functionalities of Handsontable.
Mariola: Can you tell us how did you start? What did you want to achieve?
Mirko Lorenz: The project started in late 2011. A few months later in 2012 the public beta version was published and version 1.0 was ready in December that same year. Since then, usage, output and traffic have grown from almost zero to more than 50k users, 500k published charts and roughly 5060 million “chart views” per month. We have just passed 1 billion chart views since inception, which is a remarkable milestone. Datawrapper has been popular since it’s very start in newsrooms around the world, and Handsontable was present since the beginning of Datawrapper. We were searching for projects on GitHub with a very high number of stars and that was how we found Handsontable. Since then it has been a crucial part of the data upload and refinement process.
This is where all the work you have to put in for good software makes sense: helping so many people to visualize data around the world.
What we wanted to achieve was to simplify something that was complex, and we managed to do it. Datawrapper is, in a nutshell, customizable and it simplifies the data visualization quite a bit. Simplicity therefore is one of our key goals, however it’s not easy to maintain. The second important value for us is to be of service with this tool to thousands of users. This is where all the work you have to put in for good software makes sense: helping so many people to visualize data around the world.
Mariola: What group of customers did you decide to aim with your product? What is your target market?
Mirko Lorenz: Our intended users are journalists under deadline, people with data in an NGO (non-government organization), user groups in institutions such as statistical offices, etc. For these users, speed and ease of use are essential requirements, and Datawrapper supports this by guiding them through four simple steps: first upload the data, then select a chart before adjusting the design, and finally publish or embed the chart. We ensure that the fundamental rules of charts are followed, even if the user isn’t aware of the more subtle requirements of chart design.
Mariola: How did you benefit from using Handsontable?
Mirko Lorenz: Whenever a visualization is created, people need to use a tool that will prepare the data which they are working on. Basically all available spreadsheet tools can do it for you however at some point you want to have such a tool embedded in your product. This is when Handsontable comes in handy. It provides very specific support for certain user actions such as the option to transpose the data for a certain visualization. It is possible to do that in well-known online solutions, but it would mean going back and forth.
Handsontable made it possible to move most often used actions connected with preparing, editing and filtering data (…)
Providing such options within Datawrapper was definitely the best way to make it work. However, we don’t use now all the functionalities Handsontable has to offer. Basically It helps us to keep our users focused to accomplish their goals in the quickest possible way, maintaining high quality at the same time. For the very fast-paced industry that journalism definitely is, this is a must. Handsontable made it possible to move most often used actions connected with preparing, editing and filtering data straight to Datawrapper and thanks to this, we can save even more time for our users.
Mariola: What are your plans for the future?
Mirko Lorenz: We want to focus on creating the outstanding quality of our visualizations together with a user-friendly interface.
It seems that Datawrapper is doing a great job in helping to create high-quality charts and maps as quick as a flash. We are sure they will introduce new features soon so stay tuned. It’s worth mentioning that the latest version allows users to utilize the data from a spreadsheet.
