Overview
The world runs on debt - it powers our infrastructures and it powers our businesses. But getting a business loan from a bank is not an easy task. And the process hasn't changed much in 30 years.
Inefficiencies in traditional debt capital raising
Raising and managing debt is basically hidden away in Excel formulas and PDF documents that are many pages long. It involves a lot of paperwork, calculations, and negotiations.
You have to request money, pledge collateral, pay interest, and report on the health of your business and loans. You have to do this every time you need money, and you have to do it manually, using email and Excel files. This makes the process slow, error-prone, and opaque.
You don't have a clear history or visibility of your funding operations and compliance. You also don't have a good insight into how your funding decisions affect your business performance and risk. You may end up borrowing too much or too little, paying too much or too little interest, or missing opportunities to optimize your funding strategy.
Automating debt management
But what if there was a way to simplify getting a loan and managing debt? What if you could automate funding operations, compliance, and reporting, and use data analytics to improve decision making? What if you could reduce manual work, increase efficiency, and enable better transparency and accountability?
Well, if you could, you would save time, money, and hassle, and focus on growing your business and achieving your goals.
Finley's mission
This is what Finley Technologies saw, starting them on a mission to streamline debt capital markets, make them more transparent, and bring the whole process to the digital era. And they're accelerating this change with their FinleyCMS app. They created it because they knew there was a software-driven approach to simplifying debt.

Challenge
The thing that Finley's clients have in common is they need upfront capital for their operations. From Fintech lenders to companies that do auto loans, these firms want to scale their business, so they need cash to scale with them.
In turn, they go to banks looking to raise debt capital. And then they get all the reporting and compliance requirements that come with raising debt.
Data chaos
Finley's founders realized that going through this whole process was so inefficient because there was no cloud solution. And that's because of all the disorganization and bespokeness in the reporting side of the lending industry. There's no data structure schema. People do all of the reporting, operations, and number crunching in Excel.
Communication struggles
On top of that, every Excel file looks different for every borrower. You don't always know if the data is legitimate, if the formulas are correct. This means people waste energy on a lot of back-and-forth communication because they're operating on different information sources. It creates value for no one. And with the fact that there are hundreds of billions of dollars that rely on this system, it's pretty mind-blowing.
Smooth transitioning
Besides the challenge of structuring this process, Finley had to make sure the transition to using their solution was as smooth as possible. Since the finance industry was built on Excel, this brought up a question - how do you get people to use something that isn't Excel?
Solution
Finley's answer was to create a data foundation that provides all the automation and functionality that the UI is built on.
End-to-end automation
The app starts with a powerful data pipeline that:
- connects to customers' source data,
- configures their relationship and calculation requirements,
- and automates the data cleansing and transformation process.
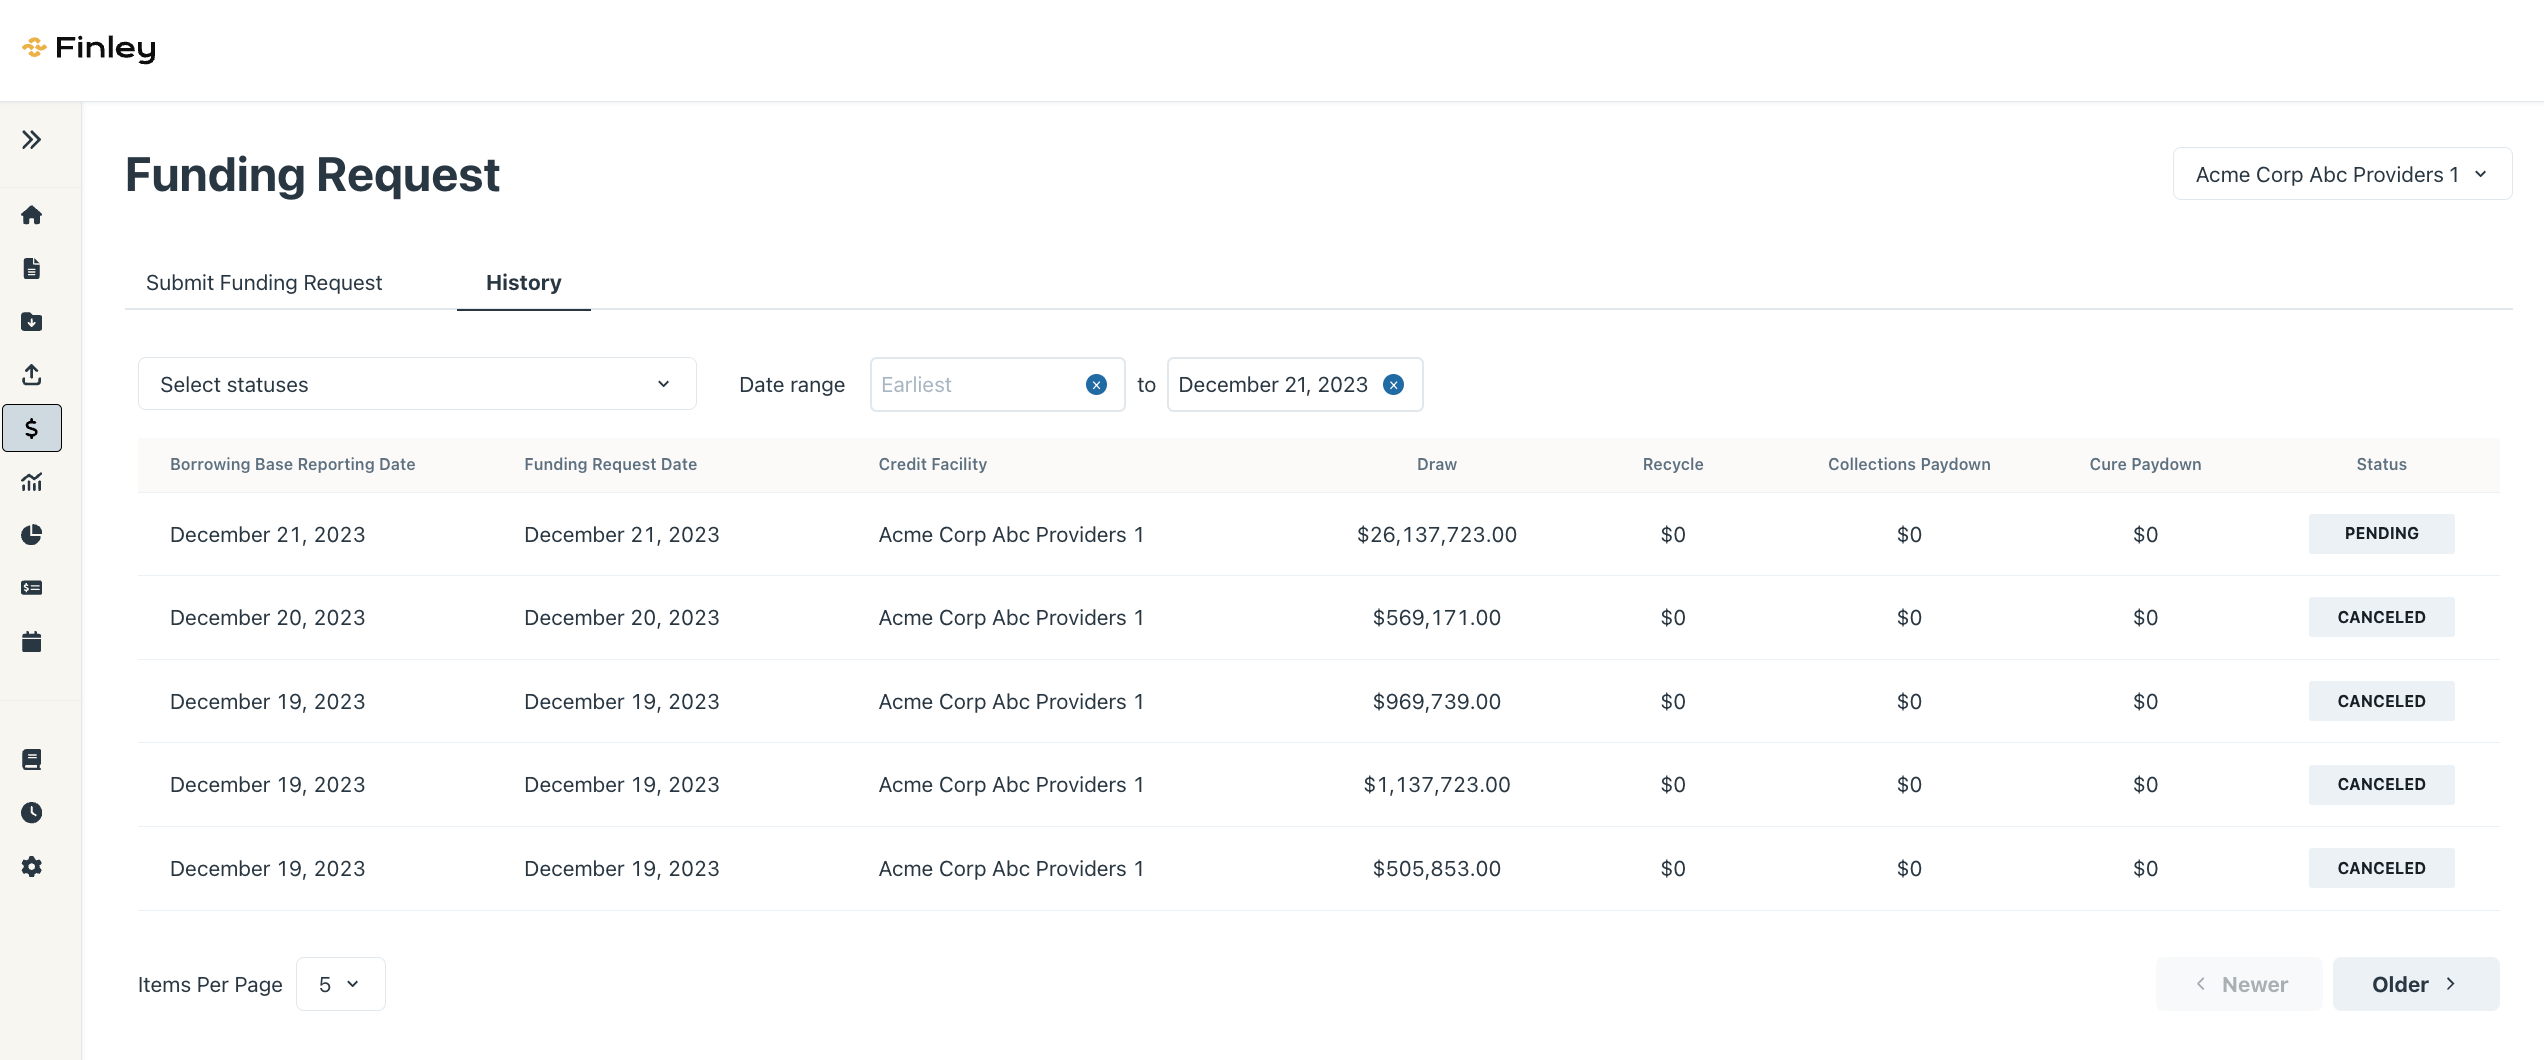
They simply log in and have the data ready to go. From there, it's a one-click experience to request the funding they need. So, the whole process of number crunching, operations, and manual work is now automated end-to-end.
Familiar UI
When it comes to the app's UI, Finley wanted to give their customers a familiar experience to smooth the switch from Excel without rebuilding the spreadsheet software from the ground up. They got that and more with Handsontable data grid.
They tested some different options, but the decision was easy with Handsontable's demo, documentation, customization, and spreadsheet look and feel.

Handsontable integration
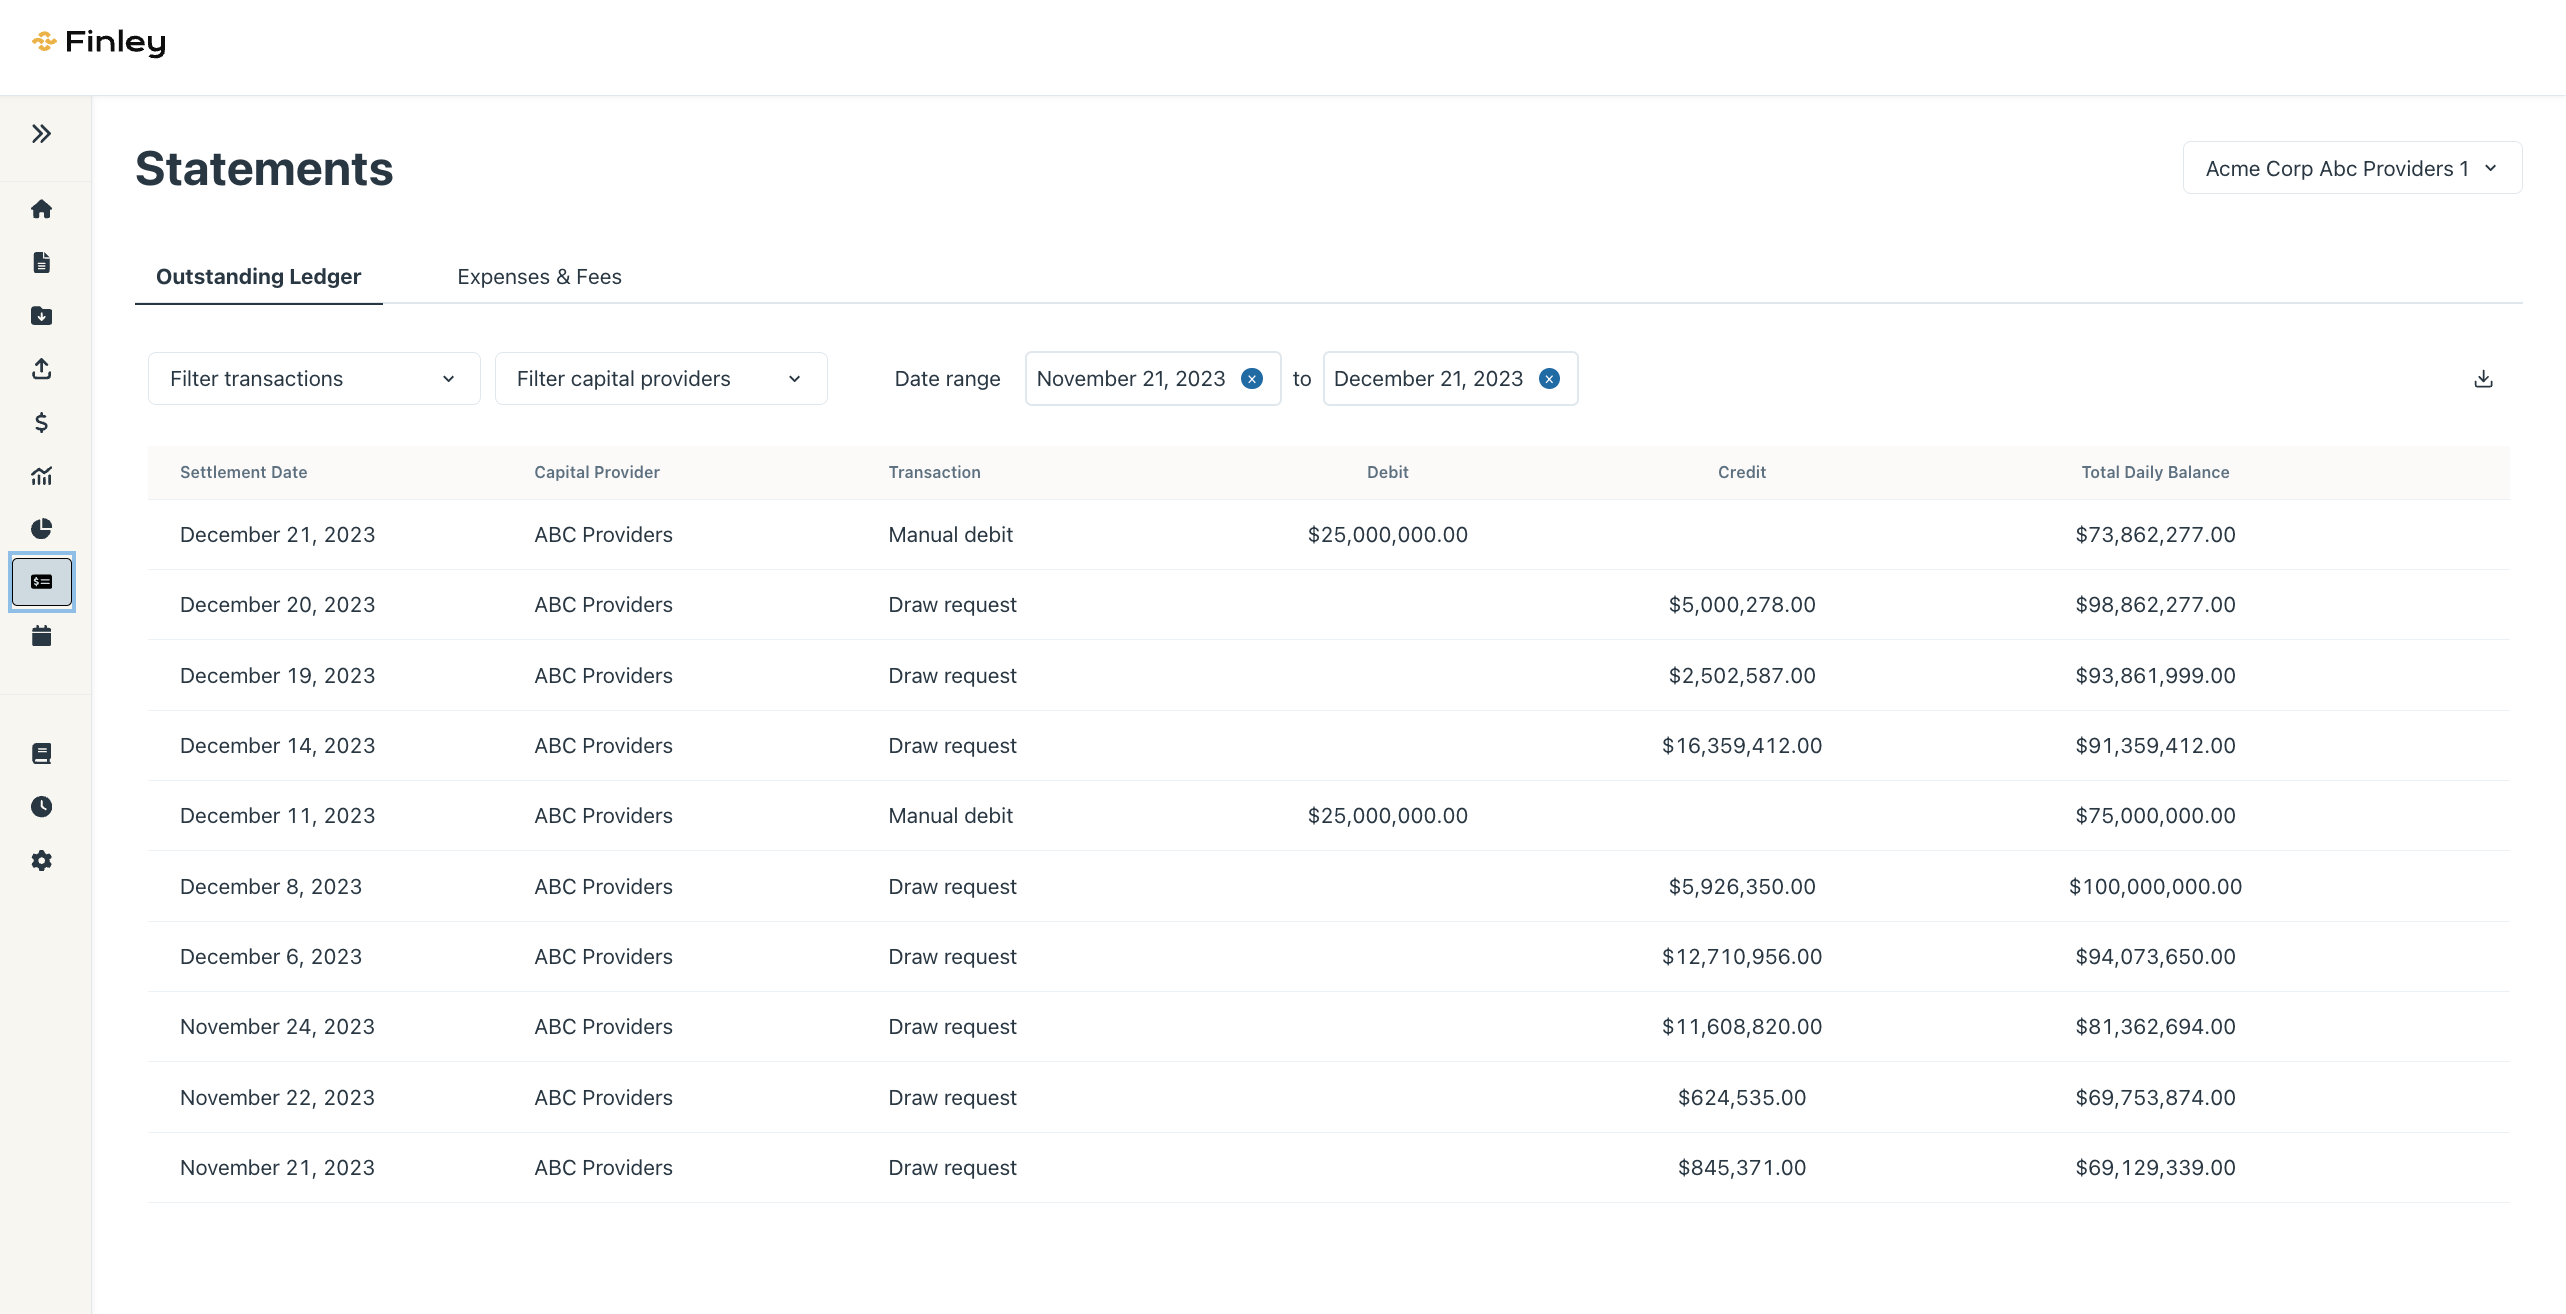
The JavaScript data grid allows them to create a purpose-built Excel UI, where users can input their data and have it powered in a way they're already used to. Handsontable easily handles Finley's data foundation and automation needs. It gives them the flexibility to define data types, schemas, validations, filters, and sorts, which are crucial for their industry. And it gives their users the performant virtualization that they want.
All in all, Finley's app is exactly what the industry has been looking for.
We love the way Handsontable allows us to put in data types and schemas and validations. It totally nails that. And it's so easy to spin it up and just be able to preload the UI and customize it quickly with parameters.
Result
The result is a universal data schema, built from the ground up, that supports customers start to finish - from finding the right capital provider to finalizing their operations in engaging with that capital provider.
Digital footprint
Not only that, the app also helps customers create a powerful digital footprint. By collecting data, automating operational needs, and providing audit histories, as well as charts and insights on loan performance over time, the app creates a sort of flashlight for the business lending industry.
Efficiency and cost savings
From a day-to-day perspective, Finley's app helps customers save time and headaches. It lets them do the minimal amount of administrative work to get the job done when it comes to funding requests, reporting, and compliance management. Because of this, customers save money on hiring someone new or outsourcing to help them with these tasks, and it lets them focus on their own product and customer acquisition.
Client satisfaction
Finley's clients are really happy with the app, and it shows through very high renewal rates and net promoter score. They're delighted by the UI, with its simple and familiar Excel-like experience, some saying the app feels just like Google Sheets. And when you put that together with the data pipeline that powers the UI, you get extremely satisfied customers.
Streamlined operations with Handsontable
With Handsontable being the core of the UI, the JavaScript data grid has been delighting Finley's customers and wowing Finley. Here are some of the benefits that have been of huge value to the company:
- Time saved in not having to build their own grid
- Quick implementation of Handsontable into their app
- Edge case coverage, depth of features, and customizability
- Professional team supporting and developing the tool
If you need a tabular UI, Handsontable is your tool. It's an end-to-end solution that makes it easy to get started so you can see a full table and see the UI quickly.
Kevin Suh
Co-founder/CTO at Finley
- Finley Technologies
- San Francisco CA, United States
- 40+ employees
- finleycms.com
