Classify spreadsheet rows with Jev, and know which answers to trust
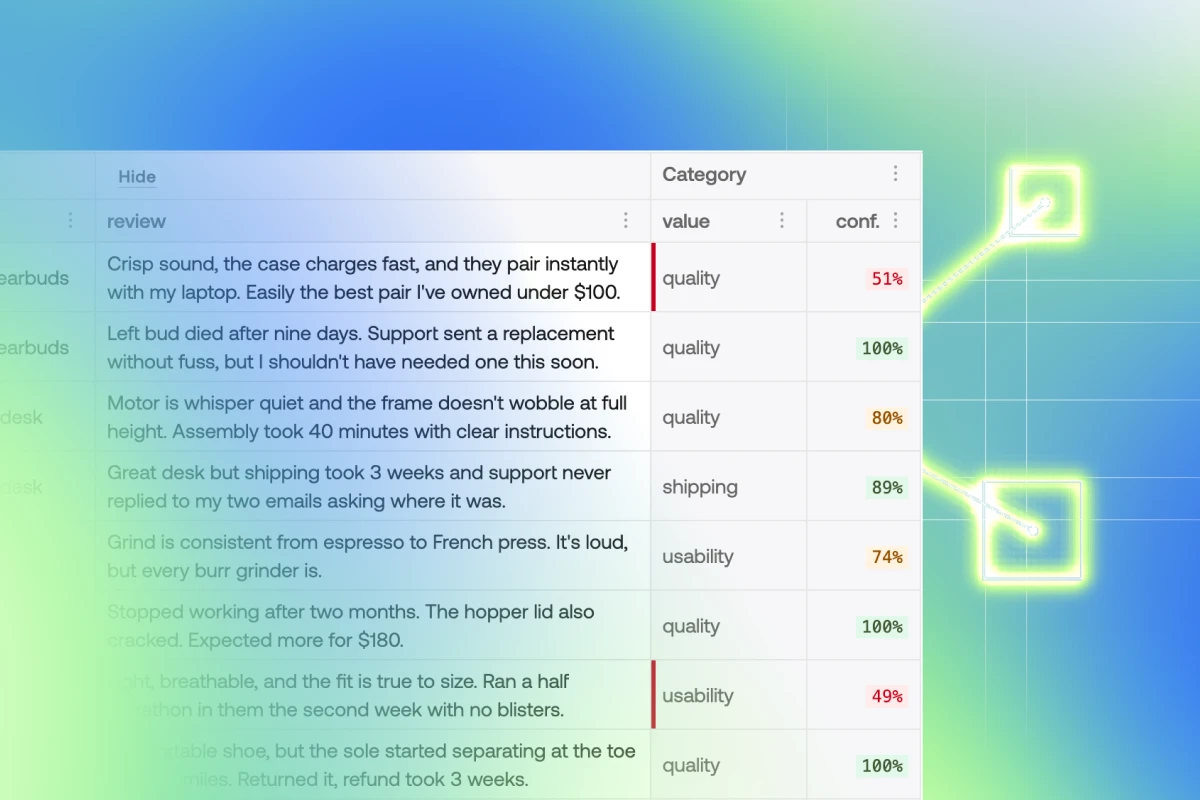
Ask an LLM to label 30 product reviews and you’ll get 30 answers that all sound equally confident. Some of them are wrong, and nothing in the output tells you which ones. So you either check every row, or you trust all of them and hope for the best.
Jev is a decision model from TypeSafe AI. You give it a typed question, like yes/no or pick one of five categories, and it returns the answer with a confidence score. Write those answers into a Handsontable DataGrid column, and the low-confidence cells tell you which rows to double-check.
Jev answers three types of question
A Noul is a yes/no question, and the answer is the probability of yes, from 0 to 1. A Score picks one of the ordered levels you define, and a Choice picks one of the options you list. Here’s what Jev returned for review #4 in the sample: “Great desk but shipping took 3 weeks and support never replied to my two emails asking where it was.”
| Type | Question | Answer |
|---|---|---|
| Noul | Does this review warrant a reply from customer support? | 0.90 |
| Score | How positive is this review overall? (Very negative … Very positive) | Mixed, 96% confidence |
| Choice | Which category best fits the main issue? (quality, shipping, price, support, usability) | shipping, 86% confidence |
Know which answers to trust
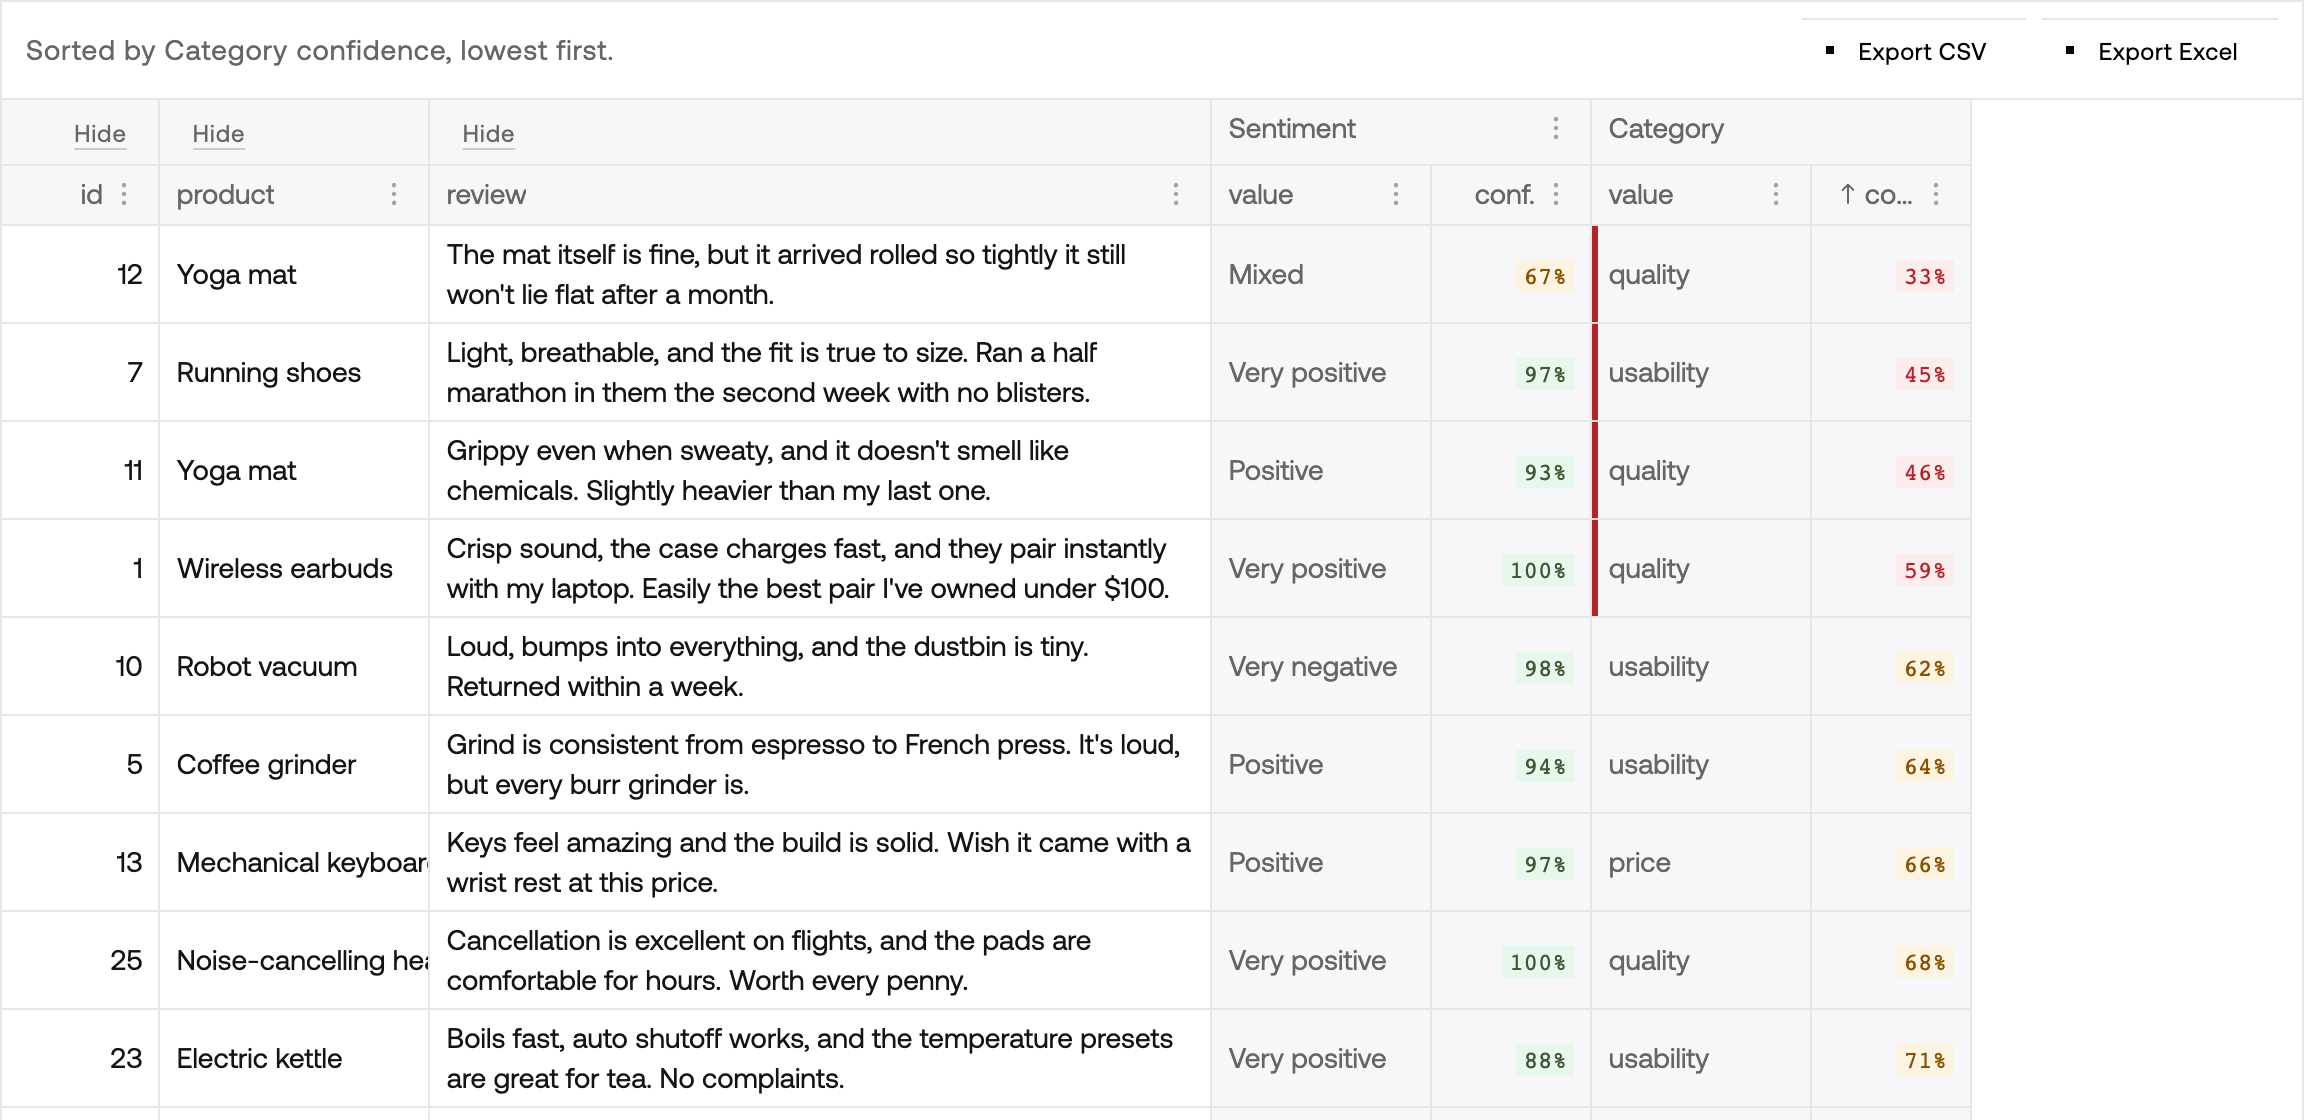
Every Score and Choice answer comes back with a calibrated confidence. That matters because the confidence is just another column, so you can sort and filter on it like anything else in the grid.
Sort the Category confidence column, and the handful of reviews that really are ambiguous float to the top. In the sample data, one review says a yoga mat is fine but arrived rolled so tightly it won’t lie flat, and Jev picks “quality” with only 33% confidence. This lets you quickly find the rows to double-check, and you can choose your own threshold of what confidence level to trust without verifying.
Triage tickets, leads, or any list of text
Reviews are just one example. The same three question types work on any spreadsheet where someone would otherwise read every row to make a decision: route support tickets to billing, bugs or feature requests, flag the ones from customers about to churn, or score a list of leads by how well they fit your product.
To try it on your own data, upload a CSV or Excel file in the live demo, describe a new column in plain English, and pick the type of answer you want. It’s free to use but limited to 50 rows. For higher limits, you can clone the repo and run it locally with your own Jev API key.
Export the labeled data to Excel
When the columns are filled, you can export the data with each answer and its confidence as columns, ready to filter in Excel or hand off to whatever comes next. Handsontable DataGrid’s ExportFile plugin supports Export to Excel and Export to CSV.
Spreadsheet formulas are preserved on import and export. Upload an .xlsx and its formulas work in the browser, recalculated in the grid by HyperFormula. Jev reads the calculated values, and the export writes the formulas back out.
Keep sensitive columns out of the prompt
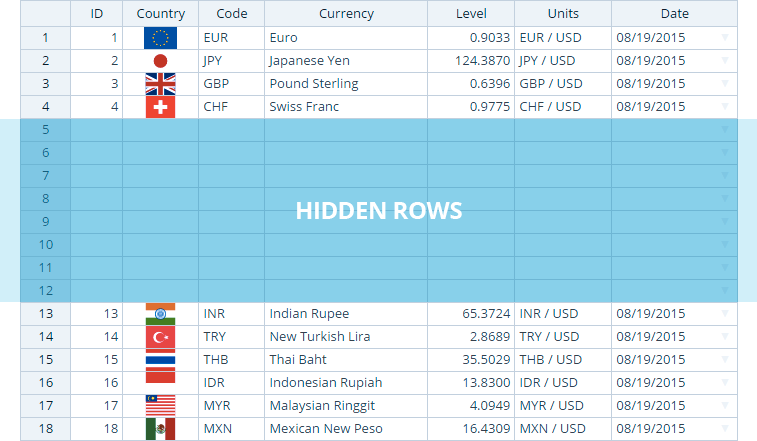
If a column holds something Jev doesn’t need, like an email address or an internal ID, click Hide above its header and it never leaves the browser. The Jev key lives in a small Cloudflare Worker that only pages on demos.handsontable.com can call, and nothing is logged or stored.
It’s cheap, too. A review row is a few hundred tokens, so classifying 50 rows into three columns costs a fraction of a cent.
Send each row to Jev
Each row goes to Jev as its own request, eight at a time, and the answer is written into its cell as soon as it comes back. Writing by physical row keeps every answer on the right row, even if someone sorts the grid mid-run. The step-by-step recipe covers the rest, from setting up the grid to the Worker that holds the key.
const res = await fetch('/api/classify', {
  method: 'POST',
  headers: { 'Content-Type': 'application/json' },
  body: JSON.stringify({ type: 'choice', prompt, options, row }),
});
const { value, confidence } = await res.json();

// Write by physical row, so a mid-run sort can't misplace the answer
hot.setSourceDataAtCell(physicalRow, 'category', value);
hot.setSourceDataAtCell(physicalRow, 'category_conf', confidence);
Match your design system, or hand it to an agent
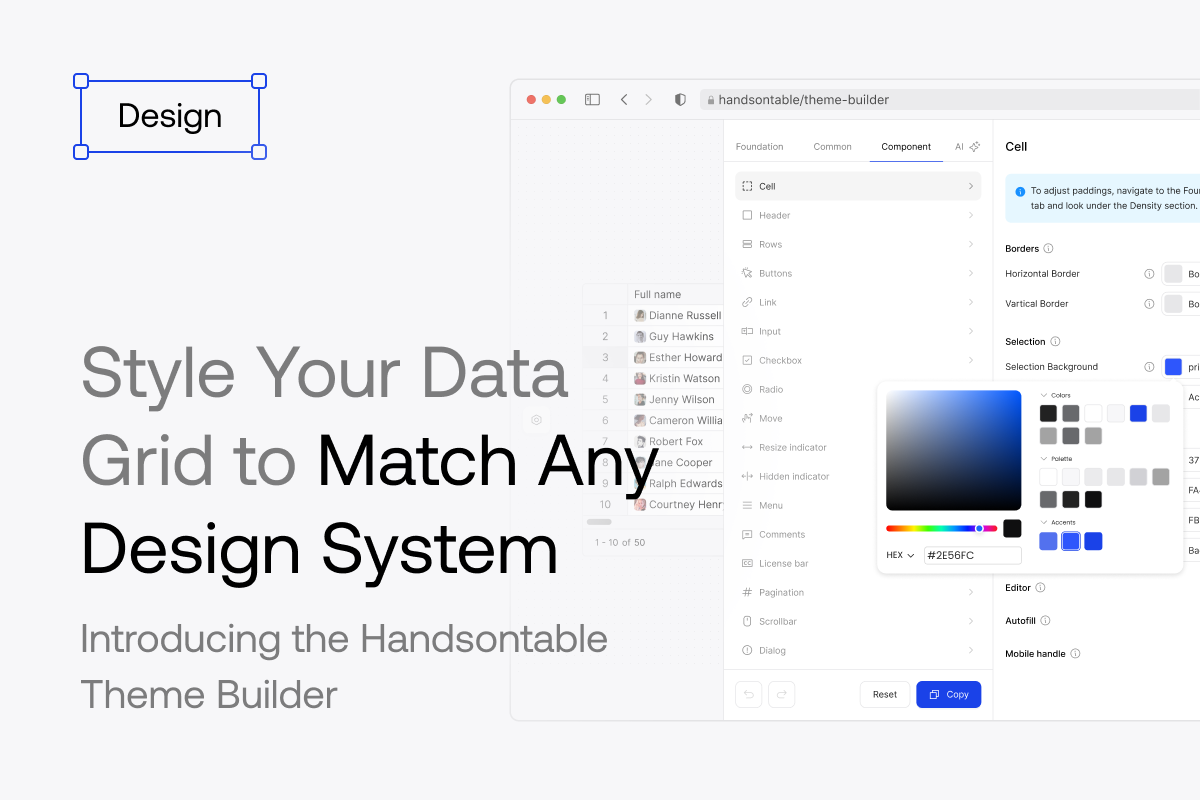
Your grid doesn’t have to look like the demo. Handsontable DataGrid themes are built on CSS variables, so you can match your design system with the Theme API, a Figma export or plain CSS overrides, or describe the look you want and let the AI Theme Builder generate the theme.
It’s also a simple case of generative UI. The model fills in a new column, and the grid around it stays the same. The A2UI recipe is a more advanced version, where an agent renders and updates the whole grid, formulas included.
Trust the confident rows, check the rest
In the sample, Jev picked a category for all 30 reviews, and only 3 came back under 50% confidence. Sort by confidence, and they’re the first 3 rows.
Try it on your own CSV in the live demo, or build it yourself with the step-by-step recipe.