
Every chart is a formula over your data
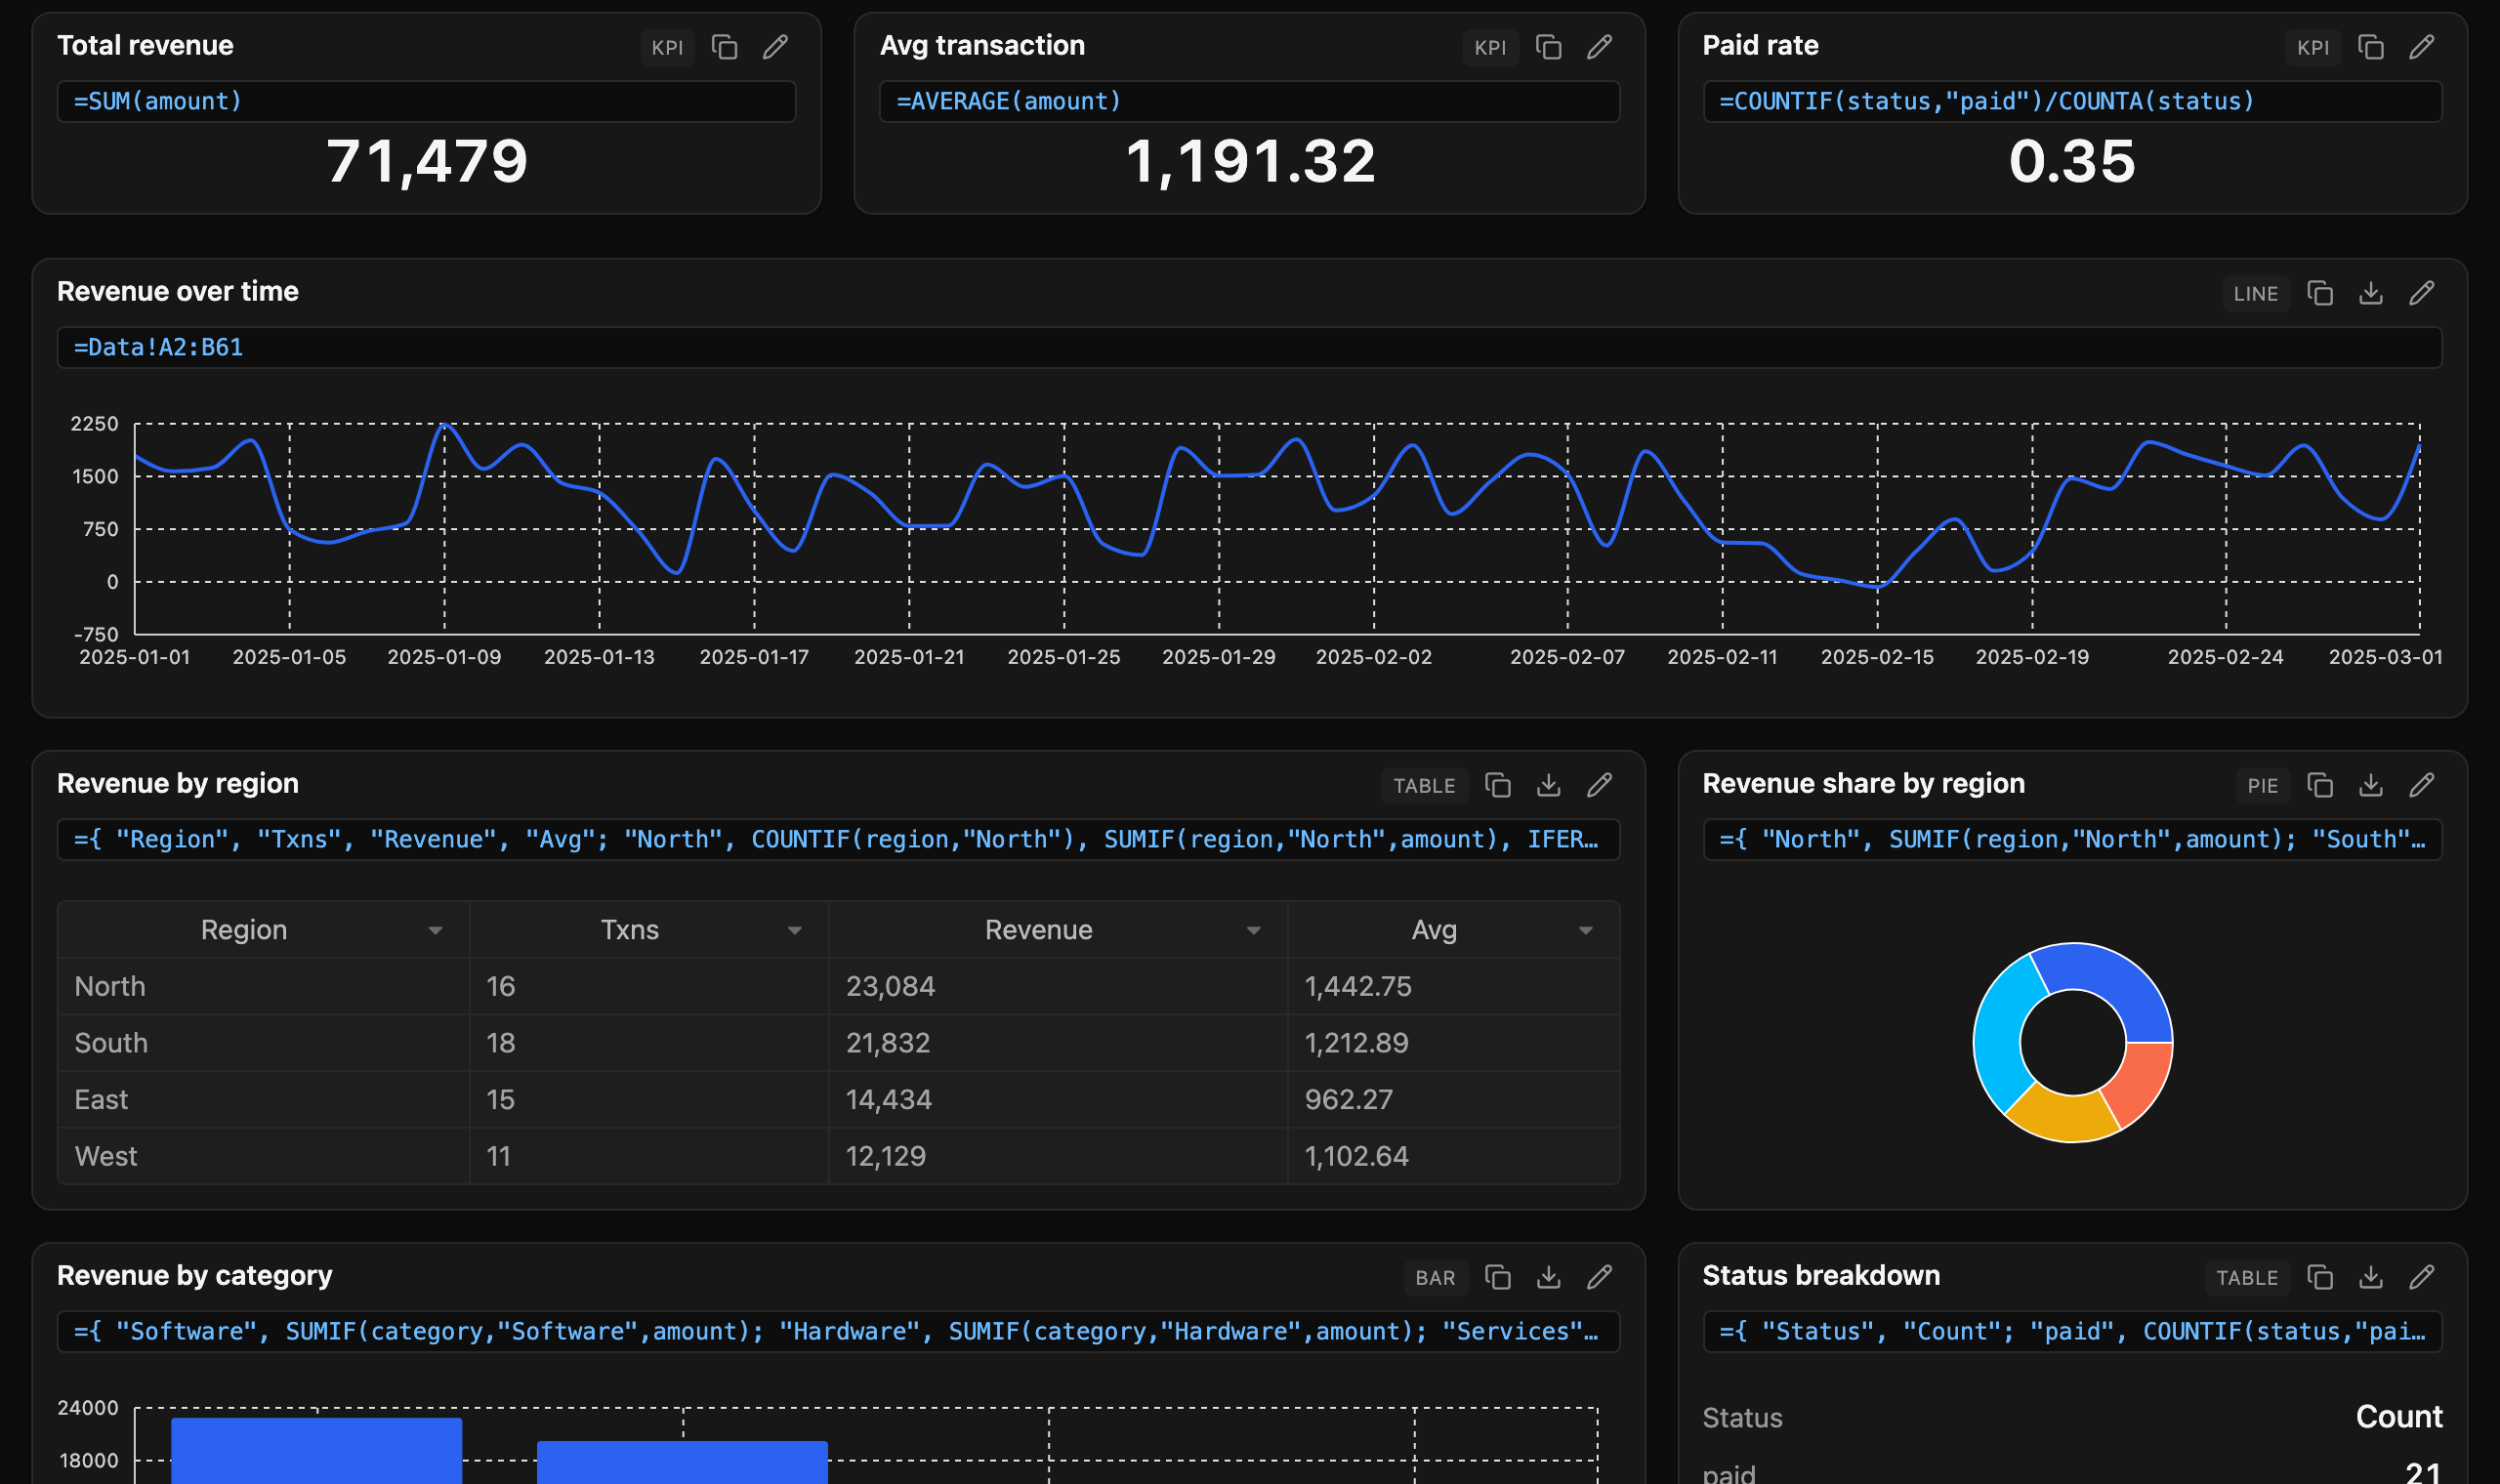
The HyperFormula Playground is a dashboard app built in Lovable on Handsontable DataGrid and HyperFormula. Load a CSV or JSON file, and each KPI, table and chart is one spreadsheet formula that recalculates when you edit the data.
A spreadsheet engine without the spreadsheet
HyperFormula is a headless spreadsheet calculation engine: it evaluates formulas in JavaScript, with no grid or UI of its own. The playground gives it one sheet of your data and asks it for one result per widget.
Three steps from a file to a dashboard
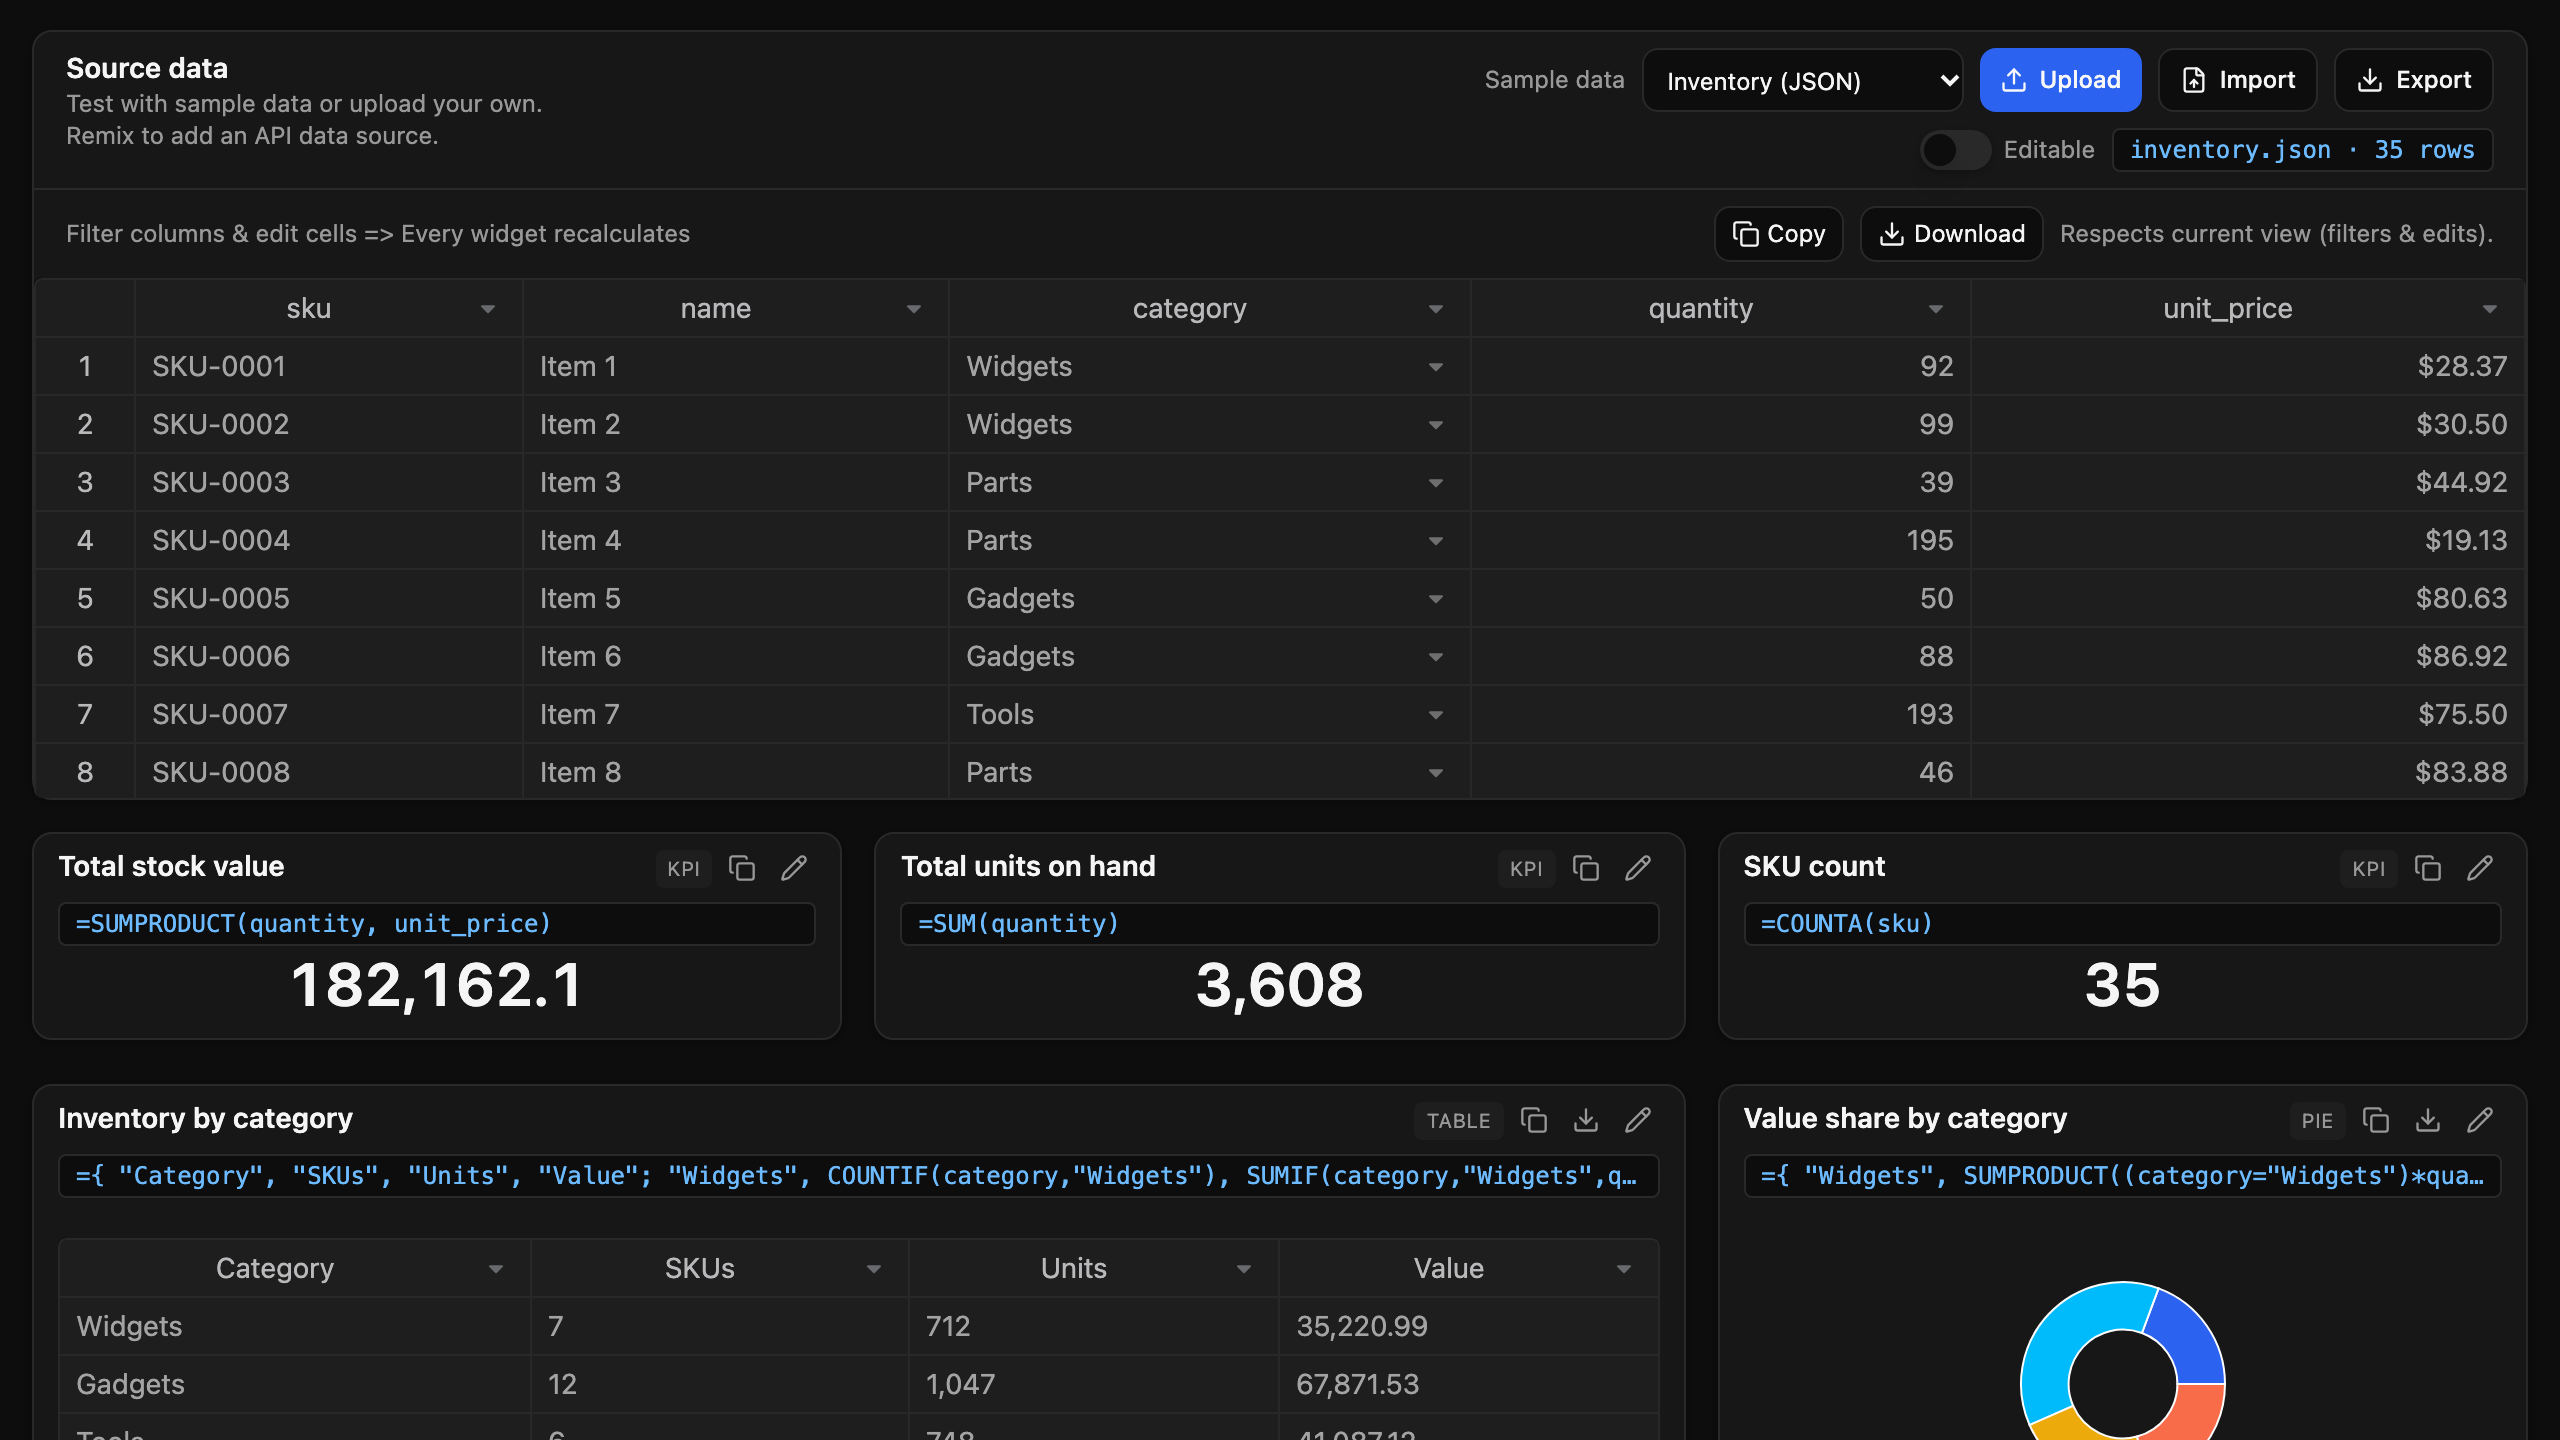
Start from one of four samples (inventory, transactions, support tickets, employees) or upload your own CSV or JSON file.
Load a file into an editable grid
Your data opens in Handsontable DataGrid as the source sheet. Turn on Editable to change values, or filter a column, and every widget recalculates against the rows you see. Copy or download the current view, filters and edits included.
- Typed columns
- Sample columns open as dropdown, numeric or date cells.
- Room for big files
- Up to 100,000 rows and 1,000 columns go into the engine.
Each widget is one formula
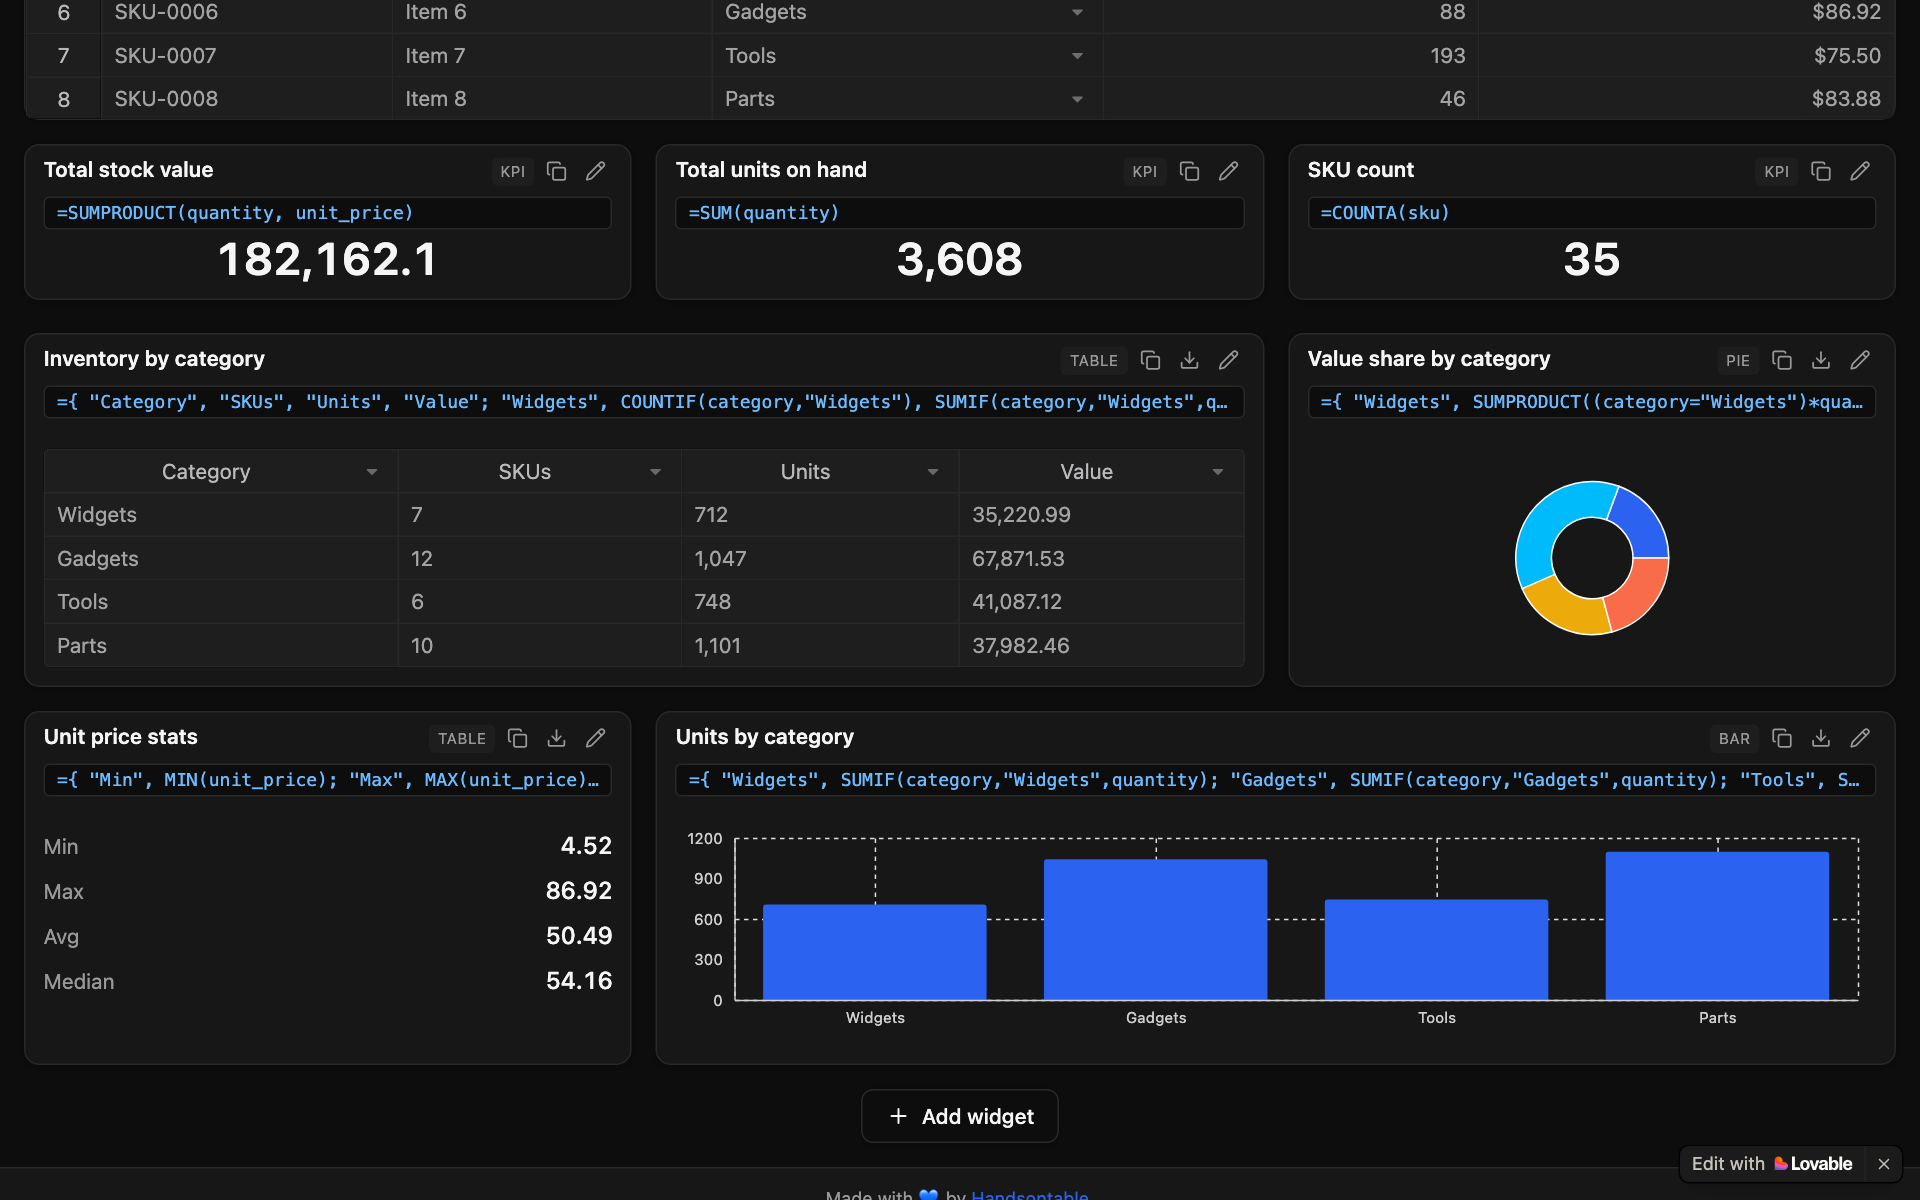
A KPI is a single formula, like =SUM(amount) for total revenue or =AVERAGE(amount) for the average sale. A table or a chart is an array formula that returns rows: a label, then its values. Edit the formula and the widget redraws.
- KPI, table and chart
- Bar, line and pie charts, each up to the full width of the page.
- Save the dashboard
- Export the widgets to a file and import them back later.
Describe a widget and get the formula
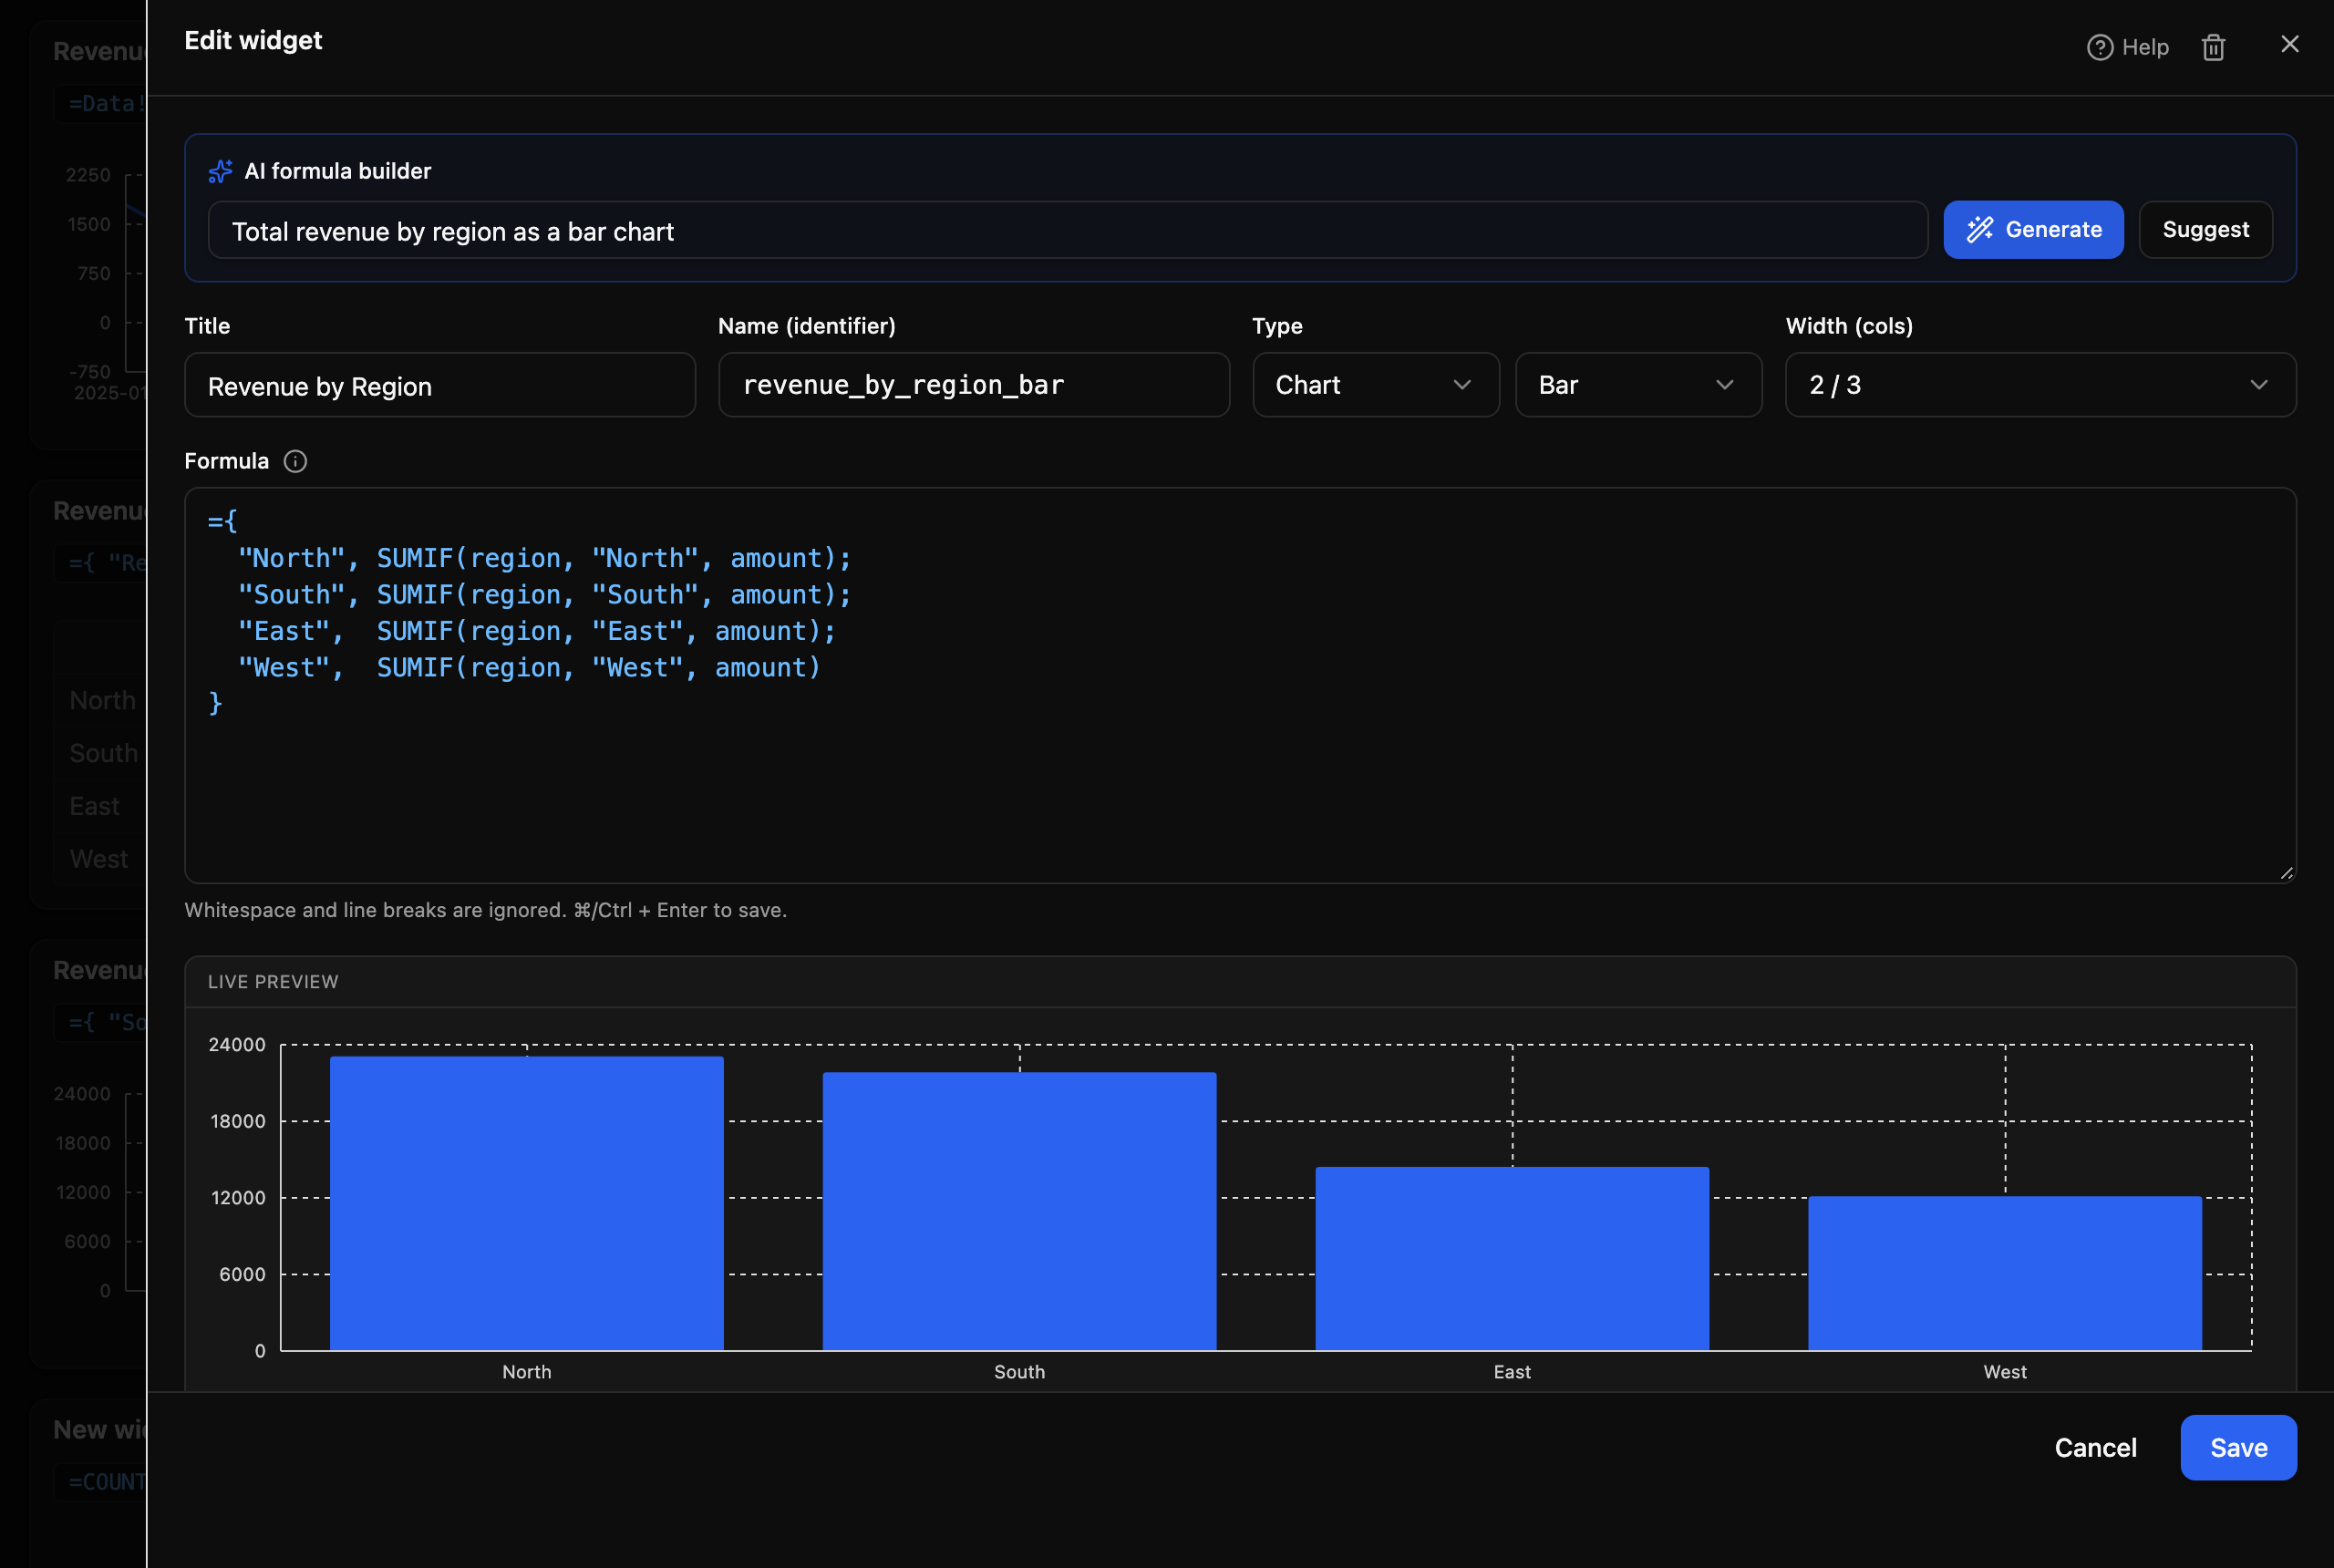
The AI formula builder takes a request like “Total revenue by region as a bar chart”, writes the SUMIF formula, picks the chart type and shows a live preview. Suggest proposes widgets from your headers. The formula is yours to read and change before you save it.
- What the model sees
- Your column names, a few sample rows and the widgets you already have.
- HyperFormula does the math
- The model writes the formula. The engine calculates the result.
Remix the playground and connect your own data
Remix copies the project into your Lovable workspace. Ask Lovable’s agent to load your API or database into the source sheet, and every widget runs against it. The app ships with gpl-v3 as its license key; swap in your own HyperFormula license key before you go to production.
const hf = HyperFormula.buildFromSheets({ Data: [headers, ...rows] },{ licenseKey: 'gpl-v3', useArrayArithmetic: true },);const sheetId = hf.getSheetId('Data')!;// Every column header becomes a named range.hf.addNamedExpression('quantity', '=Data!$D$2:$D$36');// One widget, one formula.hf.calculateFormula('=SUM(quantity)', sheetId);
Where to go from here
HyperFormula’s own guides, the engine inside the grid, and the other Lovable app.
Guides
- HyperFormula documentationSetup, the function list, named expressions and known differences from other spreadsheets.
- Named expressionsHow a name like quantity stands for a range in every formula.
- Formula calculation in the gridHyperFormula inside Handsontable DataGrid: setup, functions and known limits.
Lovable
Make every data point count. Turn millions of them into actionable wisdom.
Let’s make it easier.
Smoother. Faster. All Handsontable.