How amCharts plotted a path to an intuitive interface
Programming libraries and tools for data visualization
Introduction
amCharts is a set of data visualisation programming libraries and tools, created with developers in mind. For now the focus of amCharts is on rich, interactive charts, stock charts and maps that can easily be embedded in websites. Founded by Antanas Marcelionis more than 10-years ago, amCharts started out as a digital pin-map, and has grown to include pie, line, column and bar charts - among others - managed by a distributed team of 13 people, including two cartography specialists. Antanas Marcelionis is still the lead programmer, while Martynas Majeris, as CTO, manages both development and product design. They pride themselves on their "by choice" compactness, agility and ability to offer a superior technical support experience, with no plans to change any of this, while continuing to offer a great product for anyone needing to create rich, interactive charts and maps.
The Challenge
Although amCharts was first created with developers in mind, Antanas soon realised there was a need to make the tool accessible to non-developers. Not all users were comfortable using CSV and JSON - the standard formats for data sources in amCharts - so the team had to find a solution that would make amCharts more intuitive for all users. The tool most frequently used to manage data, across a broad segment of users, is Excel, so it would make sense for users to be able to add and manage data by way of an interface that felt familiar.
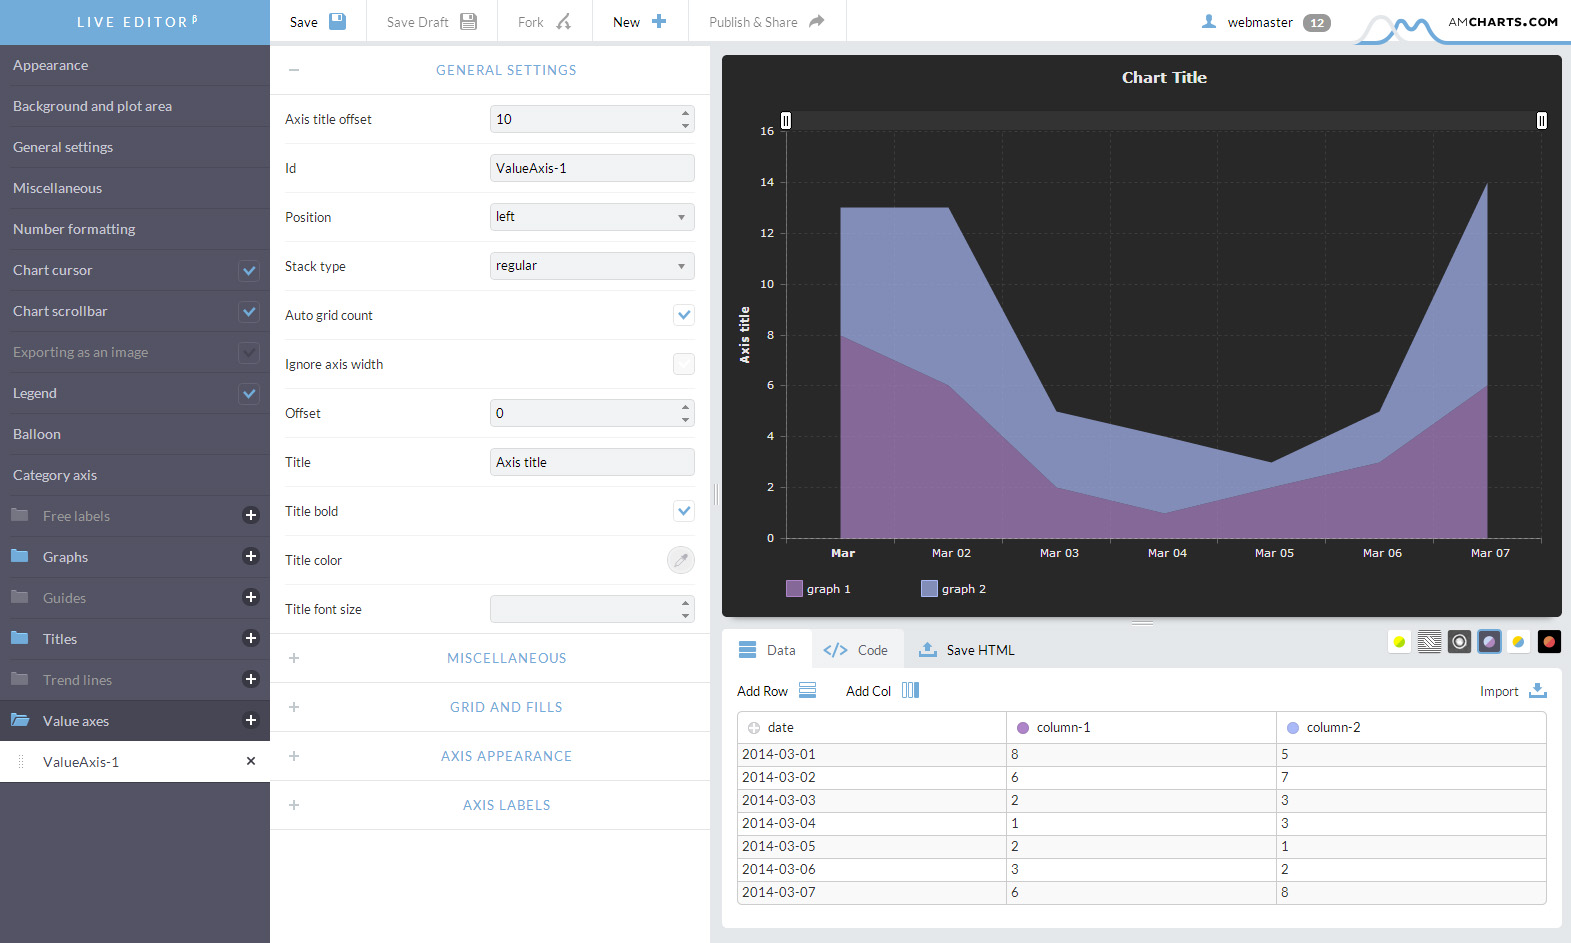
Photo credit: amCharts
The Solution
To make amCharts more intuitive and user-friendly for users unfamiliar with CSV and JSON, the amCharts team introduced the Live Editor. The Live Editor makes it possible for users to enter and manage data for their charts and maps using an interface not unlike that of Excel, with very little technical skills required of users other than knowledge of commonly used spreadsheet tools. The amCharts team realised it would make more sense to incorporate an existing solution to accomplish what they wanted from the Live Editor, rather than altering their existing development path to build their own solution, and Handsontable was this solution. With Handsontable, the amCharts team were able to add an Excel-like interface to their Live Editor much faster than if they had developed it themselves.
Being a small, agile company, we especially appreciated the ease of communication, flexibility, and willingness to go extra mile from the Handsontable team.
Results and Plans for Future
Since its introduction, Live Editor has become the primary starting point for all users wanting to create a chart or map quickly, even for users familiar with CSV and JSON. Not only does the Live Editor reduce the amount of time needed to create a new chart, it also helps to avoid the pitfalls of mistakes in your code. Martynas states that it is the flexibility of Handsontable that has led the amCharts team to look at incorporating it in future consumer-oriented products, even as development of amCharts continues at a breakneck pace. In 2016 alone they enhanced the accessibility features of amCharts, introduced an official React component and launched a multilingual plugin for WordPress, along with a slew of other enhancements and features.
Download as PDF