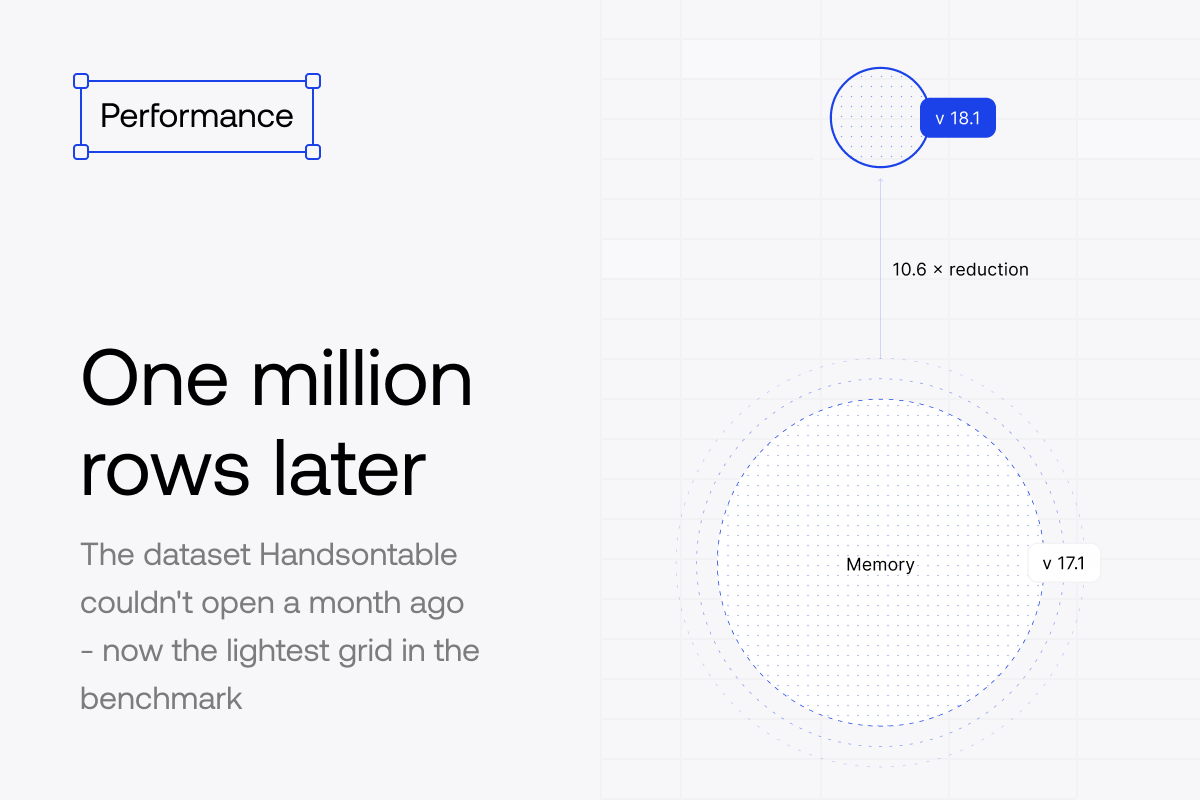
The headline number: 1,000,000 rows
The dataset size Handsontable could not even open a month ago. Now it renders with the lowest memory footprint of any grid in the benchmark.
In June, the team behind LyteNyte Grid published a thorough performance comparison of React data grids. It was good work: a public repository, a real methodology, statistical discipline. And it was not kind to Handsontable. At 500,000 rows we ran out of memory. Our heap usage was three to ten times higher than the leaders. Data replacement crawled at 7 FPS.
We ran their benchmark ourselves, on their harness, before changing a single line. The criticism was fair. Handsontable 17.1.0 did exactly what their charts said it did.
This post is about what happened in the next few weeks, and about the AI coding approach that made those weeks enough.
Credit first
LyteNyte Grid is genuinely fast. In our own reruns it held ~57 FPS vertical scroll at every dataset size we tested, including one million rows. That is the best result of any grid we measured. Nothing below argues with that. What we set out to fix was our own story: out-of-memory failures, heavy heap usage, and slow data operations.
Three weeks, thirty-one pull requests
The project ran from June 25 to July 17 and landed 31 performance pull requests across seven workstreams: the rendering engine, the viewport, index mapping, cell metadata, sorting and filtering, formulas, and core data operations. Every one of them landed in a single, isolated module, without breaking the public API. When a codebase is factored that way, an AI agent can hold an entire subsystem in its context window, and a fix that might take a sprint of cross-team coordination elsewhere becomes an afternoon’s pull request.
Memory: from “out of memory” to lowest in the test
The original benchmark’s strongest finding against us was memory, so that is where the project started, by finding the leak rather than arguing with the chart. The old diffing renderer kept a pool of every <td> it had ever rendered, keyed by absolute cell coordinates, with no eviction. After one full scroll of a 100k-row grid, that pool held 2,400,118 detached DOM nodes, while the visible DOM never exceeded about 460 cells, and the page stalled out of memory at 915 MB. The fix was not a cleverer cache; it was deleting the diffing strategy entirely and rendering straight to the DOM, so retention is bounded by the viewport by construction. A companion fix stopped initialization from creating 10,000,001 cell-metadata objects up front when nothing needed them: first render of that grid went from 3,444 ms to 110 ms (31×).
Here is the same memory metric, on the same harness, across three Handsontable versions:
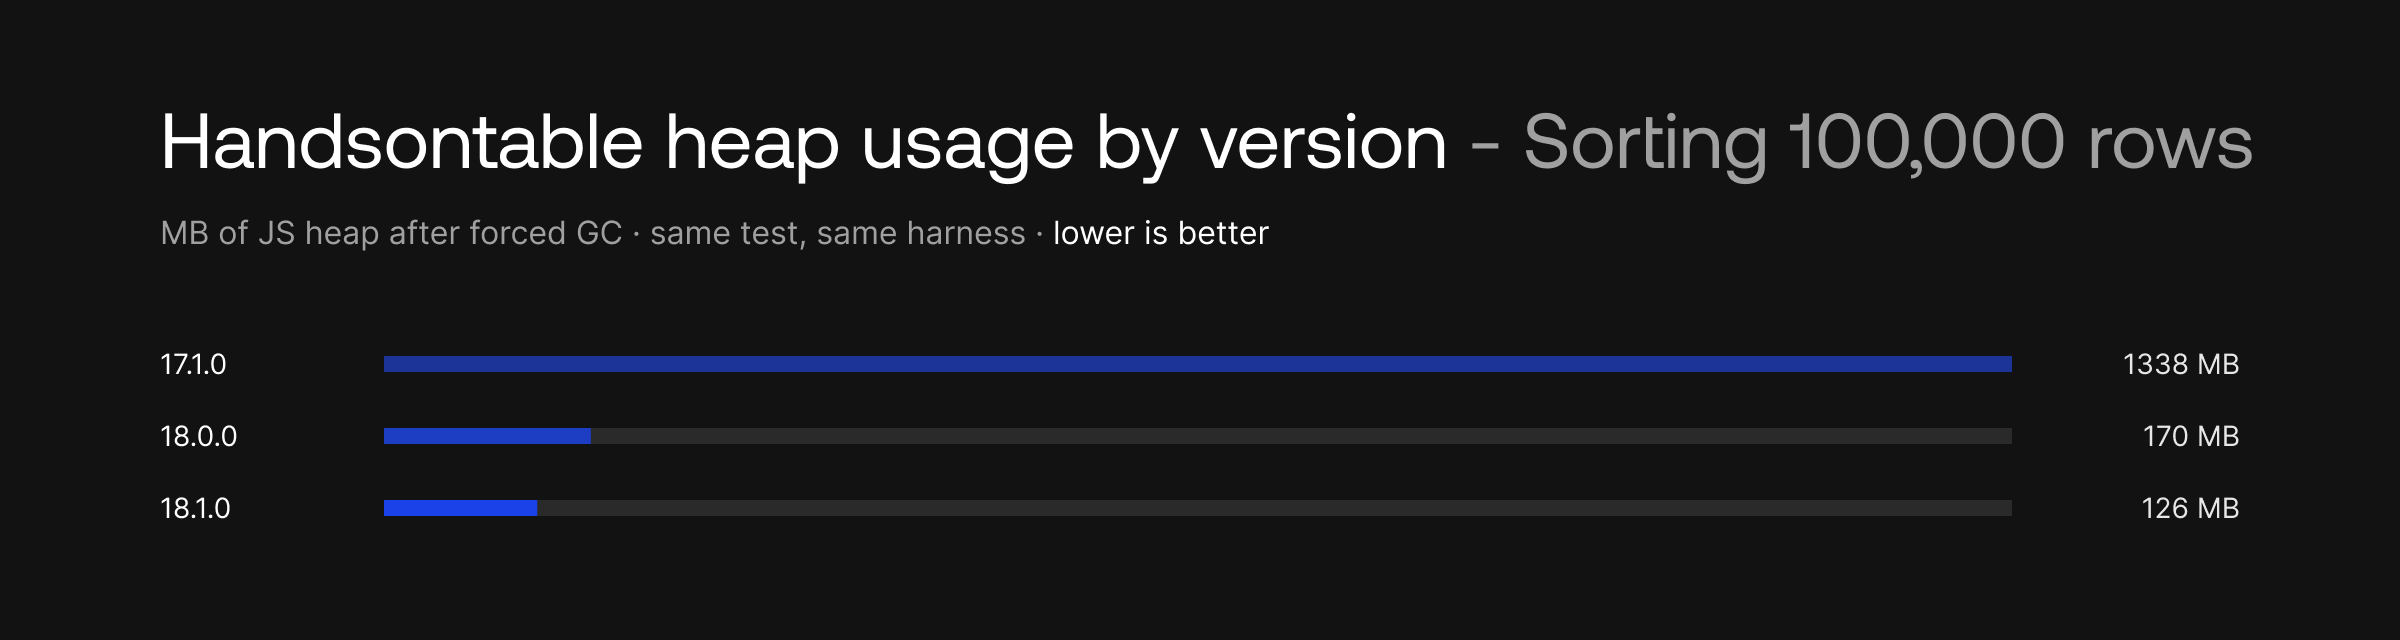
A 10.6× reduction. Version 17.1.0 is the release the original benchmark tested; 18.1.0 is our latest build. Sorting 100K shown because it was the original post’s worst memory case for Handsontable that completed at all.
And here is where that leaves the field today, at the sizes that used to break us:
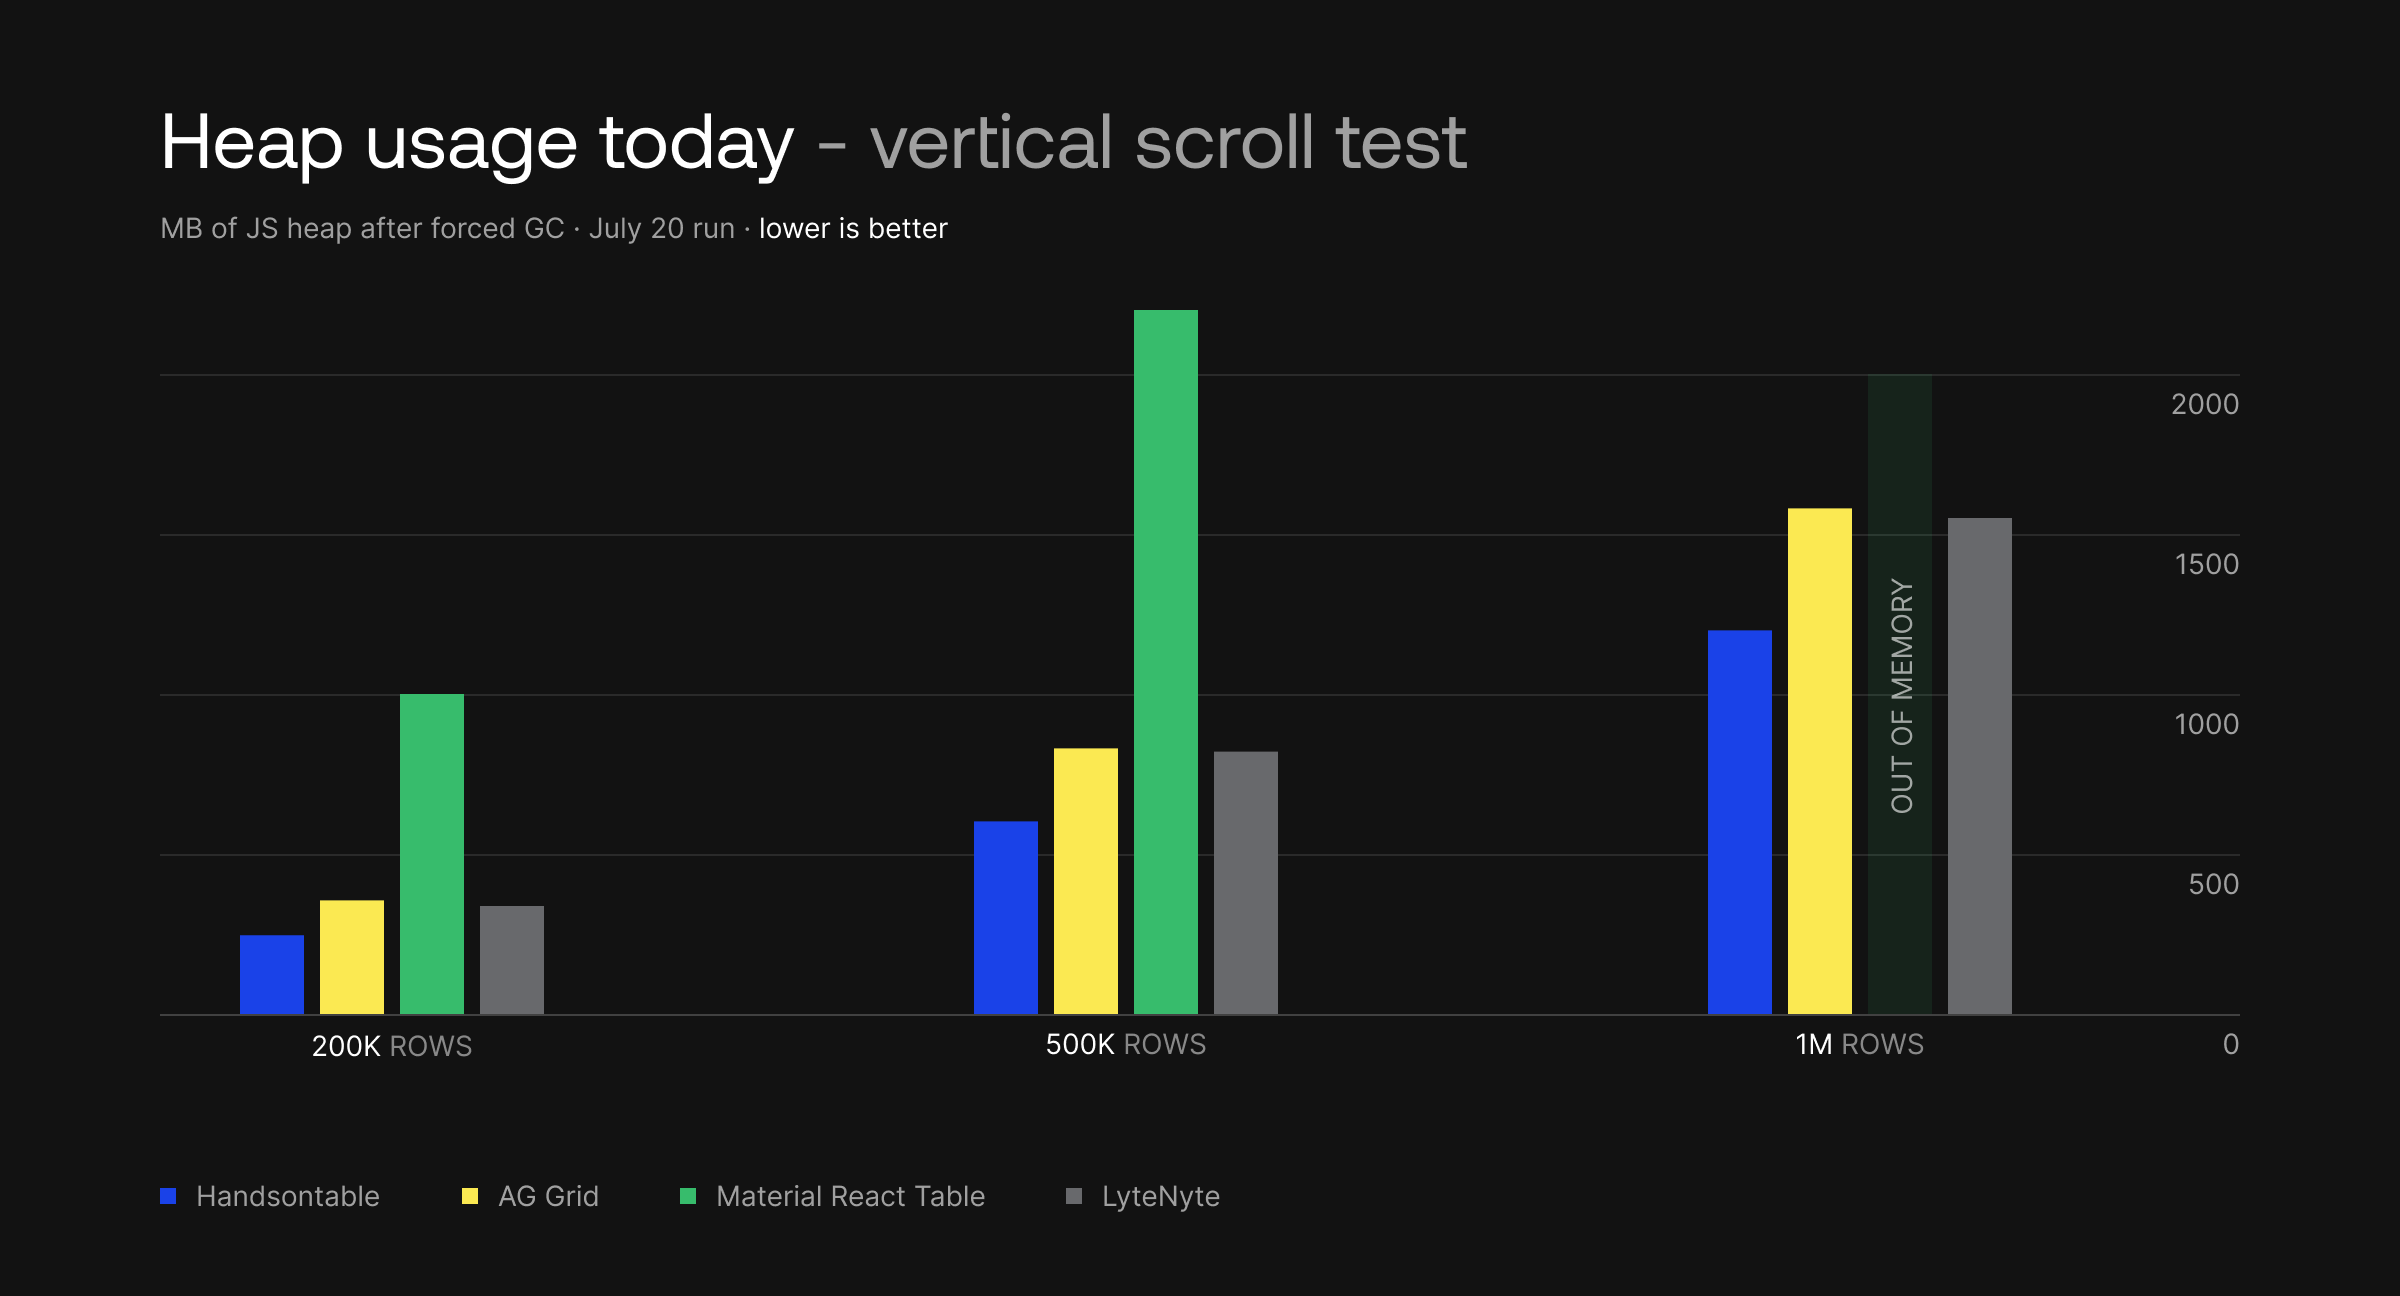
At one million rows Handsontable now uses ~26% less heap than the next grid. Material React Table could not complete the 1M test (out of memory). (We did not include MUI X in the rerun: the features the original benchmark exercised require a paid license key, and the point of this post is not to benchmark every grid, it is to show what Handsontable can do now.)
Scroll: the million-row test we used to fail
For 17.1.0 the scroll charts at 500K and 1M rows were simply empty: the grid ran out of memory before it could draw a single frame. Fixing the leak got us on the chart, but not fast. Profiling showed the strange part: Handsontable was producing the same number of frames as the quickest grids, yet each frame cost far more, because scrolling kept tearing down and rebuilding row elements. Creating one row element cost a measured 15.2 ms; rewriting the text inside 150 existing cells cost 0.3 ms. The DOM work, not the drawing, was the bill.
So the row-rendering path was rebuilt around one idea: during scroll, the DOM should not change shape at all. Row and cell elements now stay physically in place and only their contents are rewritten; rows that survive a scroll step are reused instead of recreated, so only the rows entering the viewport get touched; layout runs once per frame, with scrollbar geometry predicted instead of re-measured; and the grid pre-renders extra rows only in the direction you are scrolling. After the change, a steady scroll produces zero structural DOM mutations: measured as literally 0 node insertions or removals over a 120-step scripted scroll.
The result is the shape you see below: roughly the same ~30 FPS whether the grid holds ten thousand rows or a million.
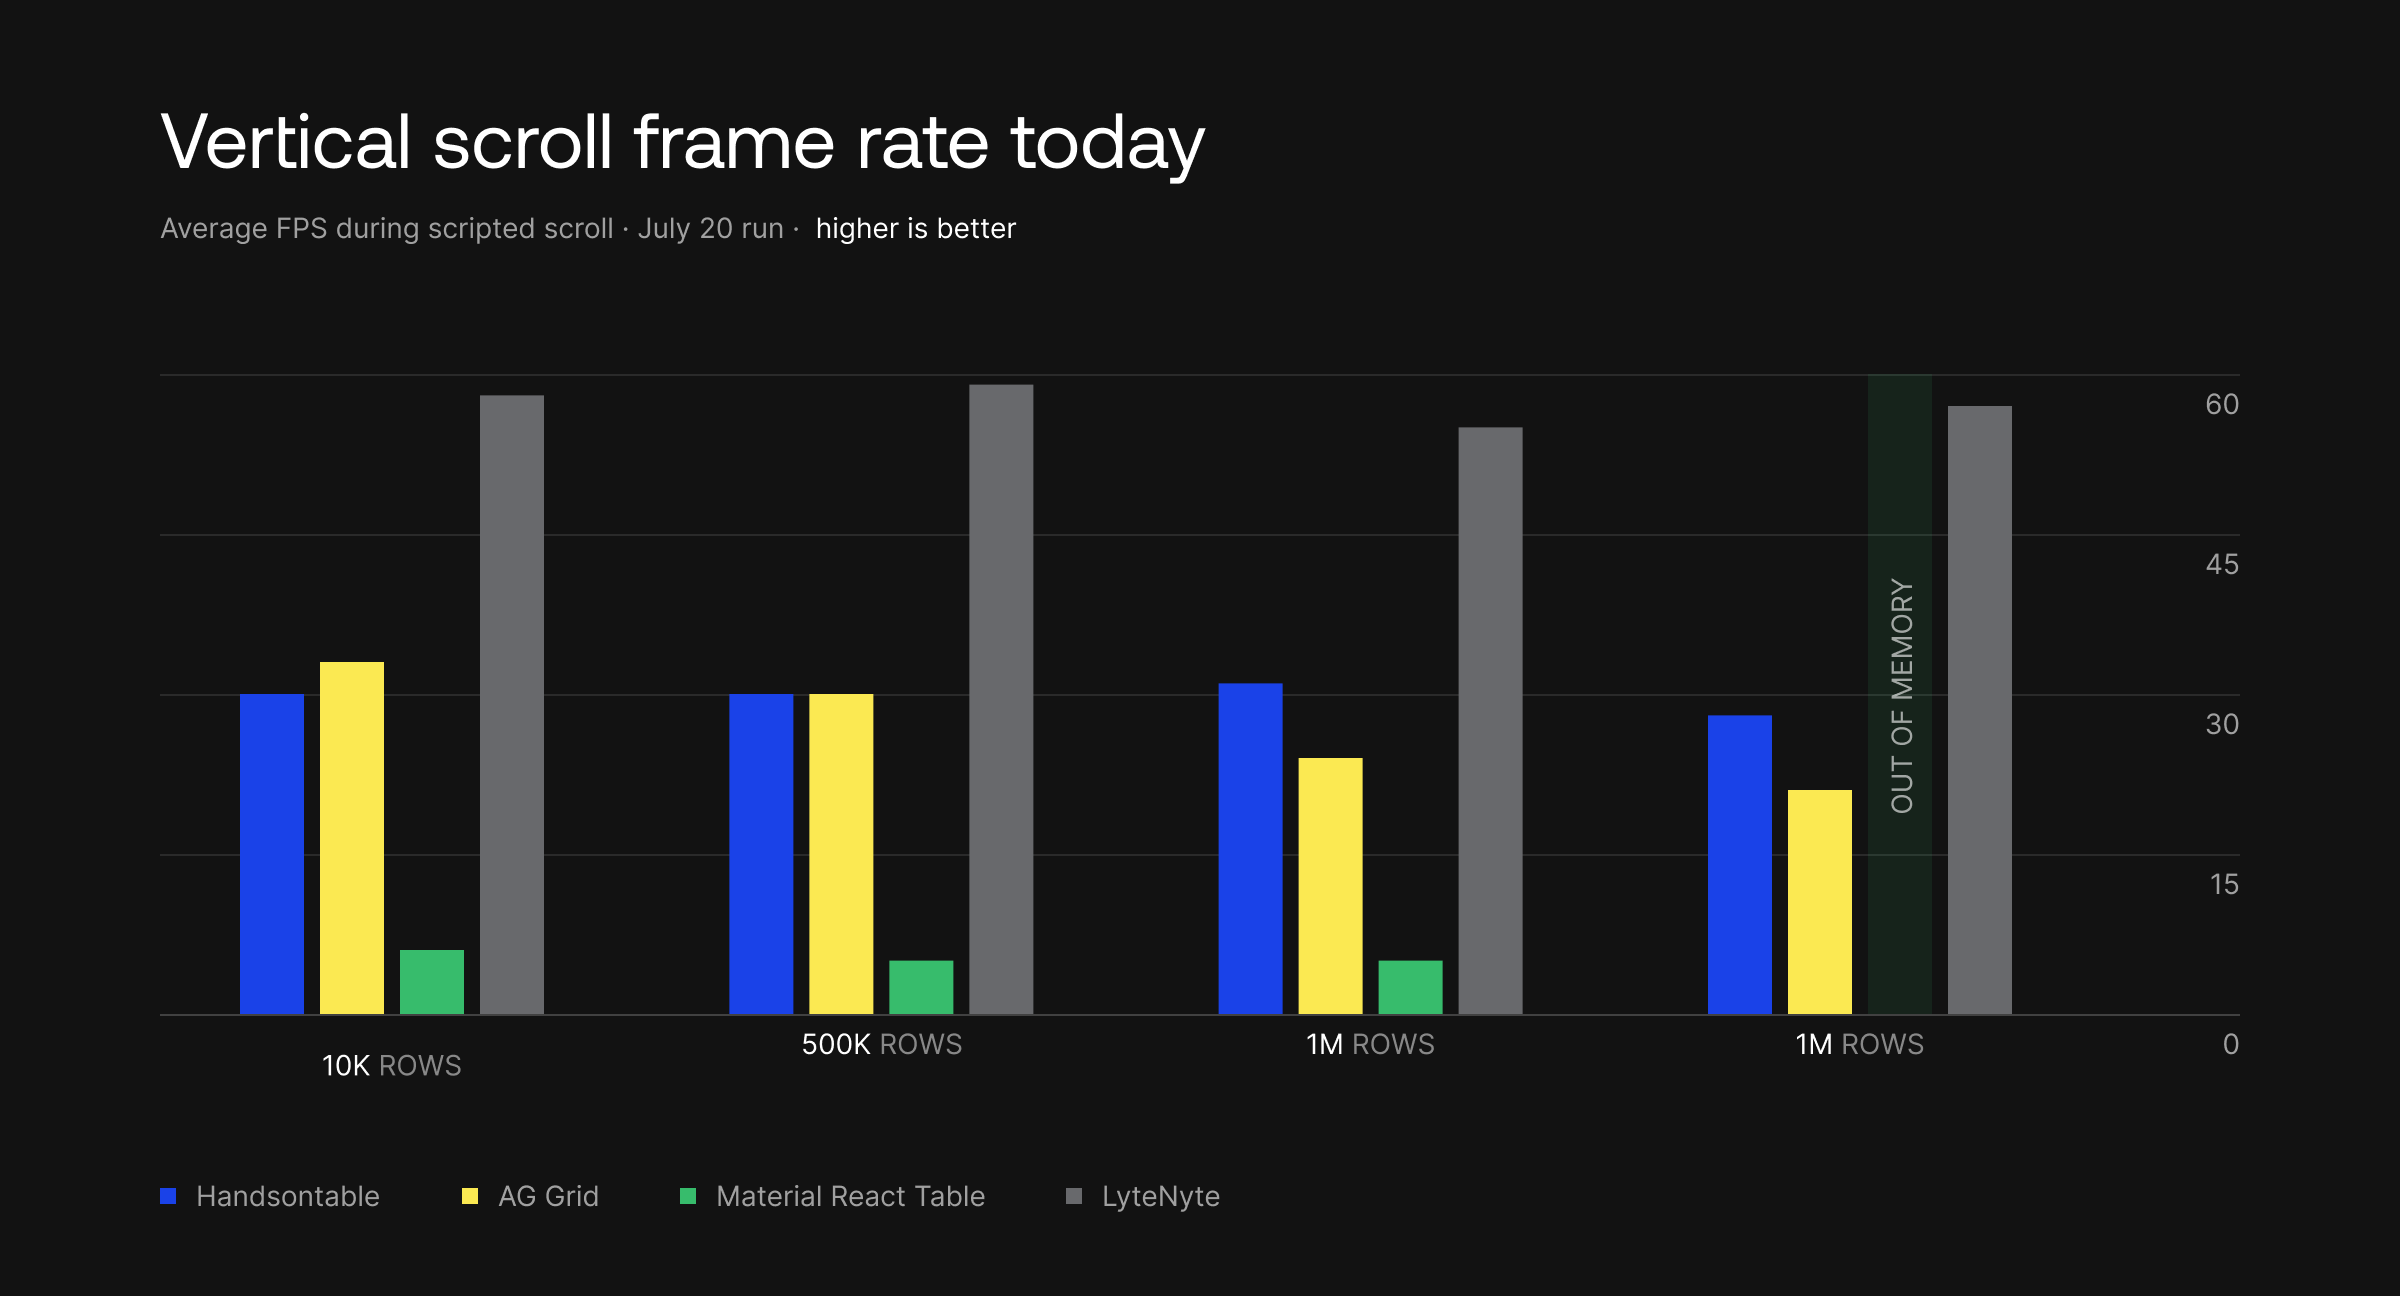
LyteNyte leads; that’s real. The Handsontable story is the shape: flat ~30 FPS from 10K all the way to 1M rows, where 17.1.0 could not render at all, and ahead of AG Grid at 500K and 1M. Cell updates went from 6.8 to 20 FPS (≈3×) along the way.
The stubborn one: horizontal scroll
One bottleneck refused to move for two straight weeks. Horizontal scrolling sat at 12 FPS while everything around it improved, a useful reminder that performance work is not one fix, it is a queue of them.
June 30 and July 10 builds: unchanged. July 13 (stationary-DOM rendering + directional overscan): doubled. July 17 (algorithmic sweep): 4× the starting point, at 2.5× the dataset the original benchmark gave Handsontable for this test.
How this actually worked: an AI audit you can argue with
The marketing version of this story is “we used AI.” The engineering version is more interesting, because the process is reproducible and its artifacts survive scrutiny.
1. A Big O audit, run adversarially
We pointed 17 AI “finder” agents at 17 subsystems of the codebase, each hunting one thing: super-linear behavior. Nested loops over data-sized collections, indexOf inside a loop, splice inside a loop, per-comparison allocations. Then comes the part that matters: every raw finding was handed to an independent verifier agent whose job was to refute it: read the real code, trace the callers, check whether that “n” is actually bounded by the viewport, whether a cache already exists, whether the path is cold.
89 raw findings came out; 13 were refuted by the verifiers; 76 survived, calibrated into 4 critical, 39 high, 32 medium, 1 low, each with a file-and-line location, a complexity class, a verified trigger path, and a measured impact. By July 17, 34 of them were fixed and merged, all four criticals among them; the rest are a ranked, costed backlog rather than unknowns.
2. Findings that make the case
A few of the confirmed criticals, in plain terms:
Keyboard scrolling re-measured the whole grid on every keypress. To find the pixel position of a target row, the scroll code added up the height of every row above it, starting from row zero. One arrow-key press at row 900,000 meant nearly a million height lookups, and holding the key down repeated that for every step. The right data structure, a prefix-sum cache that answers “how tall are the first n rows?” in constant time, already existed in the codebase; it was wired into rendering but never into scrolling. Connecting it dropped a keypress at row 900k from 92 ms to 1.9 ms, and Ctrl+End (jump to the last cell) from 207 ms to 7 ms.
Pasting into a filtered column did per-dataset work for every pasted cell. Pasting 1,000 cells into a filtered 100,000-row column took 55.8 seconds, because each individual cell triggered a re-scan of the filtered column. Collecting the affected columns first and re-scanning each one once per paste, instead of once per cell, brought the same operation to 198 milliseconds, about 280× faster.
Deleting rows shrank an internal index one row at a time. Removing 10,000 rows from a million-row grid called splice once per removed row, and each call shifts every element that comes after it, so the total cost grew with rows-removed × grid-size. Removing the whole span in one batched operation does the same job in 0.2 ms instead of 2,013 ms, a ~10,000× difference.
Column setup was asked the same question 26 million times. When 5,000 columns are configured through a columns() callback, initialization called that user function 26.2 million times, because an index translation was recomputed on every call instead of being cached. Memoizing it cut the count to ~25,000, and a related header fix took a bare getColHeader() call from 271.5 ms to 0.7 ms.
The date sorter parsed dates inside the compare function. Sorting 300,000 date rows re-parsed both date strings on every comparison the sort made: roughly 40 million parses for one sort. Parsing each date once per run and comparing the cached values cut the sort from 5.2 s to 1.1 s.
3. A diagnosis you can only get from measuring
The scroll problem wasn’t paint volume. Trace metrics showed Handsontable produced the same number of frame commits as the fastest grids (~95 per run) but three times the layout passes: 185 versus 57 on vertical scroll, 468 on horizontal. Classic layout thrashing: reads of offsetWidth and friends interleaved with DOM writes, forcing synchronous reflows. The fix series wrote itself from that diagnosis: centralize all DOM reads behind a geometry proxy, lay out once per render with predicted scrollbars, delta-render only incoming rows, keep the DOM stationary while scrolling. Each landed as its own PR in the rendering module, each verified against the same trace metrics that found the problem.
4. Measure, fix, verify — with gates
The first thing the project merged was not a fix. It was benchmark infrastructure: automated JS-heap scenarios that every subsequent change had to pass. And the agents themselves were set up so they never had to guess whether a change helped: each agent drove a real Chrome instance through the DevTools protocol (via Chrome MCP), profiled the exact scenario its fix targeted, and reported the before/after numbers from the live browser (heap snapshots, trace events, frame timings), not from reasoning about the code. Every fix in this post was individually measured that way before it was allowed to merge. Fixes that regressed anything were caught in-loop (one filter-memoization attempt broke four E2E tests and was reworked; the lesson is recorded in the audit document itself). This is, we think, the honest answer to “can AI do performance work?”: yes — when every claim it makes has to survive an adversarial reviewer, a real-browser measurement, and a benchmark gate.
What’s still true
LyteNyte still leads the vertical-scroll tests in this benchmark, and AG Grid wins the cell-updates test. Our numbers come from development builds that are still stabilizing toward release.
And one disclaimer worth ending on: benchmarks are benchmarks. They run in a synthetic, clean environment: a page that contains nothing but a grid, fed uniform data, driven by a script. How fast any grid performs in practice depends on you: the shape of your data, the renderers and plugins you enable, the application around the grid, the devices your users actually hold. Treat every number in this post as a data point, not a verdict. The repository we used is public, including our harness adjustments, so the best next benchmark is the one you run on your own workload.
The full picture: every test we ran
For completeness, here is the entire suite. First, frame rate, showing the field as it stands today:
| Test | LyteNyte | AG Grid | Material React Table | HT 18.1.0 |
|---|---|---|---|---|
| average FPS · higher is better | ||||
| Scroll 10K | 57.9 | 35.8 | 6.4 | 30.1 |
| Scroll 200K | 58.8 | 30.2 | 5.9 | 30.4 |
| Scroll 500K | 54.2 | 24.6 | 5.8 | 31.1 |
| Scroll 1M | 57.2 | 22.0 | ✗ OOM | 28.2 |
| Pinned rows & columns 200K | 47.4 | 29.2 | 3.9 | 26.4 |
| Horizontal scroll 50K | 85.3 | 65.6 | 6.2 | 49.6 |
| Cell updates (50 datasets) | 20.3 | 36.4 | 13.9 | 20.0 |
| Sorting 10K | 47.9 | 38.6 | 34.4 | 51.4 |
| Sorting 50K | 34.2 | 31.5 | 28.4 | 38.0 |
| Sorting 100K | 30.3 | 22.4 | 23.3 | 28.2 |
| Filtering 10K | 55.5 | 34.5 | 25.9 | 50.1 |
| Filtering 50K | 54.6 | 39.1 | 25.9 | 43.9 |
| Filtering 100K | 49.8 | 30.0 | 25.0 | 34.0 |
Green = fastest in the row; red = slowest, or failed to run.
And memory, where the change is most visible. Handsontable now has the smallest footprint in 12 of the 13 tests:
| Test | LyteNyte | AG Grid | Material React Table | HT 18.1.0 |
|---|---|---|---|---|
| MB of JS heap after forced GC · lower is better | ||||
| Scroll 10K | 54 | 47 | 228 | 19 |
| Scroll 200K | 360 | 356 | 1,002 | 246 |
| Scroll 500K | 830 | 844 | 2,224 | 602 |
| Scroll 1M | 1,624 | 1,657 | ✗ OOM | 1,199 |
| Pinned rows & columns 200K | 361 | 355 | 1,016 | 246 |
| Horizontal scroll 50K | 98 | 117 | 241 | 68 |
| Cell updates (50 datasets) | 44 | 64 | 88 | 66 |
| Sorting 10K | 34 | 47 | 87 | 19 |
| Sorting 50K | 103 | 112 | 261 | 66 |
| Sorting 100K | 196 | 193 | 478 | 126 |
| Filtering 10K | 30 | 46 | 85 | 19 |
| Filtering 50K | 96 | 111 | 254 | 67 |
| Filtering 100K | 180 | 193 | 459 | 127 |
Green = lowest memory in the row; red = highest, or failed to run. All figures: average of 20 recorded iterations after 5 warm-ups, July 17 run.
Handsontable, then and now
And the same tests for Handsontable alone, comparing the version the original benchmark tested against our current development build:
| Test | HT 17.1.0 | HT 18.1.0 | Change 17.1.0 → 18.1.0 |
|---|---|---|---|
| avg FPS · MB of heap after GC | |||
| Scroll 10K | 26.1 144 MB | 30.1 19 MB | 1.2× faster · 7.6× less memory |
| Scroll 200K | 25.0¹ 2,010 MB¹ | 30.4 246 MB | 1.2× faster · 8.2× less memory¹ |
| Scroll 500K | ✗ out of memory | 31.1 602 MB | could not run → runs |
| Scroll 1M | ✗ out of memory | 28.2 1,199 MB | could not run → runs |
| Pinned rows & columns 200K | 17.1² 278 MB² | 26.4 246 MB | 1.5× faster, at 10× the rows² |
| Horizontal scroll 50K | 17.8² 274 MB² | 49.6 68 MB | 2.8× faster, at 2.5× the rows² |
| Cell updates (50 datasets) | 6.8 77 MB | 20.0 66 MB | 2.9× faster · 1.2× less memory |
| Sorting 10K | 32.2 139 MB | 51.4 19 MB | 1.6× faster · 7.3× less memory |
| Sorting 50K | 20.7 672 MB | 38.0 66 MB | 1.8× faster · 10.2× less memory |
| Sorting 100K | 13.6 1,338 MB | 28.2 126 MB | 2.1× faster · 10.6× less memory |
| Filtering 10K | 36.9 139 MB | 50.1 19 MB | 1.4× faster · 7.3× less memory |
| Filtering 50K | 20.2 672 MB | 43.9 67 MB | 2.2× faster · 10× less memory |
| Filtering 100K | 13.7 1,339 MB | 34.0 127 MB | 2.5× faster · 10.5× less memory |
¹ Handsontable 17.1.0 could only complete this test at 150,000 rows; the 18.1.0 build ran the full 200,000, so the real change is larger than the ratio shows. ² 17.1.0 ran 20,000 rows here (the original harness gave Handsontable smaller datasets); the 18.1.0 build runs the full dataset. ✗ = the grid ran out of memory and never rendered.
The short version: across the tests both versions could complete, 18.1.0 averages about twice the frame rate of 17.1.0 and typically uses 7–10× less memory. And the two tests 17.1.0 could not run at all, scrolling at 500,000 and one million rows, now hold a steady ~30 FPS.
Method notes
All measurements: the 1771 Technologies public benchmark harness, with three adjustments for symmetry: every grid gets the same dataset sizes (the original gave Handsontable 150k/20k/20k rows on three tests), row headers off on scroll demos (no other grid renders them), and one browser launch per grid per iteration. 5 warm-up passes, 20 recorded iterations, averaged. Headed Chrome, 2000×1200 viewport, 1920×1080 grid, 300 columns. Memory = JS heap after forced GC. Versions: Handsontable 18.1.0, LyteNyte 2.1.3, AG Grid 35.3.0, Material React Table 3.2.1. MUI X excluded (license key required for the benchmarked features).

Krzysztof Budnik
Handsontable core team member. He uses Vanilla JS on a daily basis. Privately a geek and gamer.